New Study Shows High Arrest Rates for Returning Prisoners–What Are the Policy Implications?

Every decade or so, the U.S. Bureau of Justice Statistics releases a big national study of prisoner recidivism. The latest BJS research came out last week, and the numbers were no less depressing than they were in 2002. Here’s the report’s lead:

Overall, 67.8% of the 404,638 state prisoners released in 2005 in 30 states were arrested within 3 years of release, and 76.6% were arrested within 5 years of release.

Failure seems to be the norm, not the exception, for individuals released from U.S. prisons.

High recidivism rates constitute the most difficult and important challenge for those of us who would like to see fewer long sentences and more generous opportunities for inmates to earn early release. If most prisoners are rearrested shortly after they get out, doesn’t that lead inexorably to the conclusion that we should err on the side of more, not less, time behind bars?

Certainly, the woeful recidivism numbers should take indiscriminate, mass releases off the table. On the other hand, I think it is possible to overstate the significance of national rearrest rates for sentencing and corrections policy. These numbers should be the start, not the end, of the conversation.  

Continue ReadingNew Study Shows High Arrest Rates for Returning Prisoners–What Are the Policy Implications?

Violence in the Heartland, Part VI: Cities Within the City

My most recent posts in this series have compared violent crime data from different cities. However, focusing on a single crime-rate number from a city may mask wide neighborhood-to-neighborhood variations within the city.

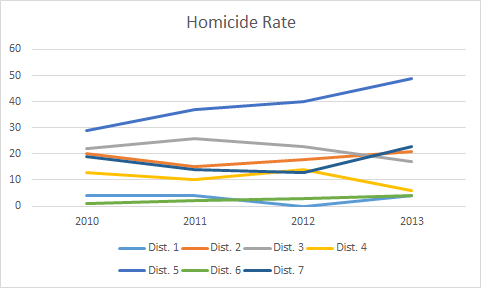
Consider Milwaukee. A helpful on-line data tool permits interesting comparisons among the city’s seven police districts. The data reveal that rates of violent crime vary within the city by about as much as they do across cities. Here, for instance, are the homicides per 100,000 district residents since 2010:

district homicide

District 5, encompassing the north-central portion of the city, has easily had the highest homicide rate each year, while Districts 1 (downtown and northeast) and 6 (far south) have easily had the lowest. (District boundaries are described in more detail here.)

Robbery rates reflect a similar pattern:  

Continue ReadingViolence in the Heartland, Part VI: Cities Within the City

Violence in the Heartland, Part V: Wisconsin’s Cities

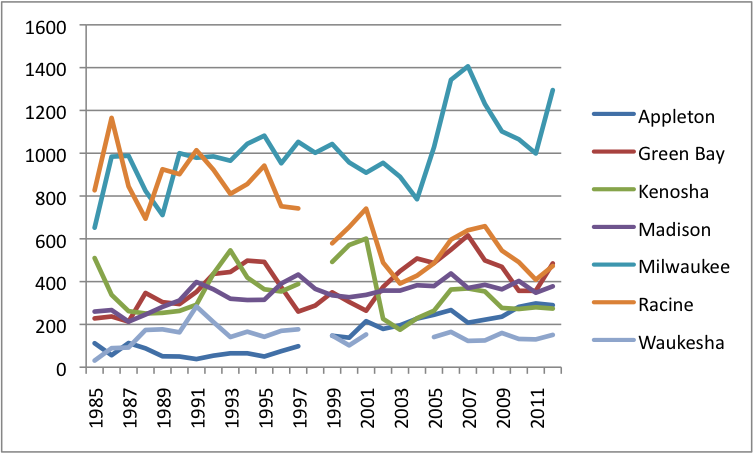
Since 1985, Wisconsin’s seven largest cities have followed markedly different paths in their rates of reported violent crime.  Two, Waukesha and Appleton, have consistently had lower rates than the state as a whole, while two others, Milwaukee and Racine, have typically had rates that are two to three times higher than the state as a whole.  Kenosha and Racine have significantly reduced their rates of violence since the 1980s, while the other five cities have experienced sizable net increases.

Here are the overall trends, in the form of reported violent crimes per 100,000 city residents:

Cities year by year

In recent years, as you can see, Waukesha has easily had the lowest rates and Milwaukee the highest.  Earlier, Appleton used to compete with some success for lowest and Racine for highest.

Here are the net changes in the cities’ crime rates from 1985-1987 to 2010-2012:  

Continue ReadingViolence in the Heartland, Part V: Wisconsin’s Cities