Get ready for 6 years of Supreme Court races
Wisconsin has held just 1 Supreme Court race in the past four years, but that is about to change. The 2025 SCOWIS race kicks off a six-year streak of annual elections. Six out of seven seats will be elected before the next redistricting cycle.
The rest of this post will briefly recap how the current 7 justices were elected. These races cover a wide variety of circumstances and likely give a good preview of things to come. If the past few years are any guide, these races will feature high turnout and extreme partisanship.
Appointment calculus
All of the current justices are serving a ten-year term to which they were elected. It’s fairly common, however, for justices to end their terms early, whether due to death or retirement.
When this happens, the governor independently appoints a successor, with no involvement from the legislature. That appointed justice then stands for election in the first year “when no other justice is to be elected,” per Wisc. Stat. 8.50(4)(f)1.
Consequently, if Janet Protasiewicz (elected in 2023) were to resign (or otherwise leave office), the governor’s appointed replacement would serve until an election in 2031. If another of the current justices vacates before their term ends, their appointed successor will serve until the year when their election was already scheduled.
Subscribe to John’s newsletter to receive these posts in your inbox.
The stakes
Voters this April will choose whether liberal candidate Susan Crawford or former Republican Attorney General Brad Schimel will replace retiring justice Anne Walsh Bradley on the bench.
Bradley is part of the 4-justice liberal majority, so a victory by Schimel would flip control of the court for at least another year. Liberals would have a chance to win it back in 2026 or 2027, when the terms of Rebecca Bradley and Annette Ziegler, respectively, end.
If Crawford wins, conservatives will have to wait until at least 2028 for another shot at the majority. Also, the liberals could double their 1-justice majority by flipping either of the next two races.
How this court got here
Spring elections in Wisconsin can feature an eclectic mix of offices including judicial races, school boards, the state superintendent, constitutional referendums, and presidential primaries. The specific set of races on the ballot varies each year.
Even with this variation, there is a clear trend of growing participation in SCOWIS elections.
The following table shows the results of the races that elected each of the current seven justices.
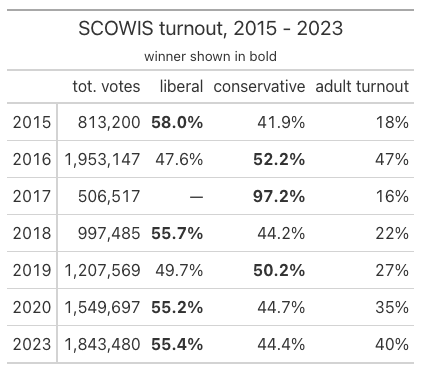
- Just 18% of adults voted in 2015, when Anne Walsh Bradley was last reelected.
- The next SCOWIS race coincided with the 2016 presidential primary. 47% of adults participated and the court result almost perfectly matched partisan primary participation. 52% of voters participated in the GOP primary and 52% voted for the conservative judicial candidate, Rebecca Bradley.
- In a sign of their general disarray following Trump’s first victory, liberals in Wisconsin failed to field a candidate in the 2017 SCOWIS race. Annette Ziegler was reelected by the 18% of adults who participated. The other statewide race on the ballot was for school superintendent, which the future Democratic governor Tony Evers won with 70% of the vote. To me, this is the last spring election in Wisconsin to have actually felt relatively nonpartisan.
- 22% of adults voted in 2018, when liberal Rebecca Dallet defeated conservative Michael Screnock by 11.5 points in an open race to replace retiring conservative Michael Gableman.
- The 2019 race was also open, after longtime liberal justice Shirley Abrahamson retired. Conservative Brian Hagedorn narrowly defeated liberal Lisa Neubauer by 0.5 points in a race with 27% participation.
- The 2020 SCOWIS race coincided with the presidential primary, but unlike 2016, there was no Republican primary and the Democratic primary was nearly over, (Biden’s last opponent dropped out a few days later). Turnout was 35% and liberal Jill Karofsky defeated conservative Dan Kelly by about 11 points.
- In 2023, the SCOWIS race was the most prominent contest on the statewide ballot, and its consequences were widely understood: namely, majority control of the court. Turnout was 40%, higher than in any previous spring election not corresponding to a presidential primary. Conservatives once again ran Dan Kelly. He lost to liberal candidate Janet Protasiewicz by slightly more than his defeat to Karofsky in 2020.
Just as turnout in SCOWIS races has gradually risen over the past decade, so has the degree to which partisanship shapes the outcomes. This graph, from my colleague Charles Franklin, shows the correlation between judicial votes and presidential votes in each county.
In 1978, the correlation between how a county voted for state Supreme Court and how it voted in the previous presidential election was 0.002. In 2016, it was 0.869. And in 2023, it was 0.964.

What to expect in 2025
In April 2025, I anticipate continued high turnout. The last time a state superintendent race overlapped with a contested SCOWIS race was 2013, but the stakes in this election seem more similar to 2023, when the outcome of the race would determine majority control of the court. Also like 2023, this race features candidates who voters can easily connect to policy positions on hot topics like abortion access and redistricting.
Beyond its policy consequences for Wisconsin, this race will be a test of a leading theory about the 2024 election—that Democrats are the off-year party now. Republicans, the theory goes, win with voters who are less likely to participate in non-presidential contests. The reverse used to be true, with Republicans more often winning low turnout elections.
If Crawford wins, it will bode well for Democrats hoping to win a trifecta in Wisconsin in the 2026 midterms. A Schimel victory would suggest that conservative support is more vigorous and reliable than the Trump-specific low propensity voter narrative suggests.
 Kimo Ah Yun calls his personal history an “underdog story.” He was one of the large number of young people across the United States who had the ability to do big things, but who came from circumstances where doing them was rare.