New dataset traces Milwaukee’s long foreclosure crisis

The dramatic consequences of the late 2000s subprime mortgage crisis on Milwaukee neighborhoods are well known, but specific data on foreclosures has been remarkably difficult to come by.

Previous studies have documented plummeting homeownership across the city (particularly on the north side), followed by a surge in out-of-state investment. But researchers have lacked public data on how many foreclosures occurred, who initiated them, which properties experienced them, and the subsequent ownership history of those parcels. To fill that gap, I have assembled a novel dataset of residential foreclosures matched to city parcel records for the years 1995 through 2022. This includes all detached single family homes, condos, duplexes, and triplexes. See the data note at the end of this article for details.

From 1995 through 2006, the city saw an average of 800 house foreclosures a year. Then, in 2007, there were over 1,300 foreclosures. That jumped again to almost 2,500 in 2008. During the decade of 2007-2016 my records show a total of 21,500 foreclosures.

The pandemic, with its attendant boom in home values, saw foreclosures drop to their lowest levels since at least 1995. I found records of 351 foreclosed homes in 2020, 393 in 2021, and 434 in 2022.

Over the past 3 years, foreclosures by lenders have declined, likely because rising home values mean that few homeowners find their mortgages underwater. A homeowner struggling to make their mortgage payment can often avoid foreclosure by selling the house for a profit.

By contrast, foreclosures over delinquent taxes grew from 72 in 2020 to 138 in 2021, and 211 last year. As property values increase, the number of owners struggling to pay their tax bill may be increasing.

bar plot showing the total number of tax and mortgage foreclosures per year

The wave of foreclosures during the housing crisis was geographically concentrated in poor and majority nonwhite neighborhoods. In 2012, for instance, the 3rd aldermanic district (covering the east side) experienced 54 foreclosures, or a rate of 8 per 1,000 houses. The neighboring 6th district simultaneously saw 217 foreclosures, a rate of 24 per 1,000. Meanwhile, homes in the 15th district (covering parts of the near west and near north sides) were foreclosed on at a rate of 35 per 1,000 just in 2012 alone.
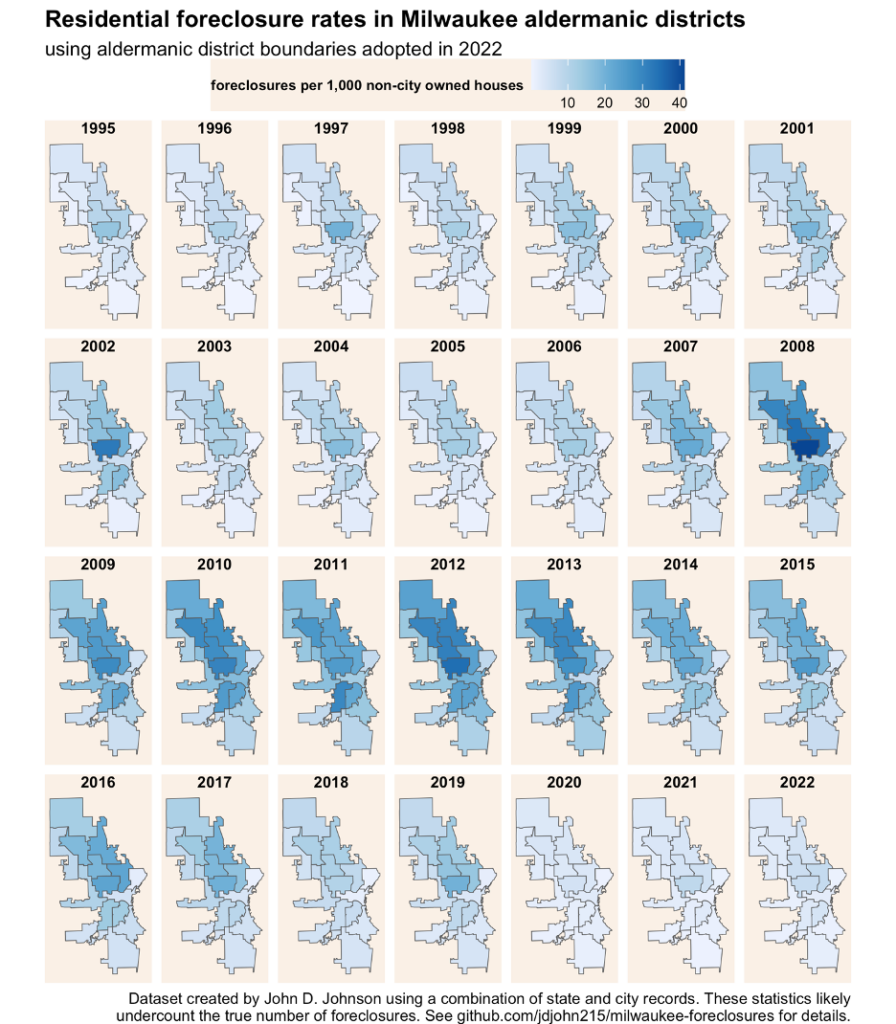
small multiple maps showing the annual rate of foreclosures in Milwaukee aldermanic districts

The cumulative effect after a decade of unrelentingly high foreclosure rates is mindboggling. Citywide, 14% of all houses experienced at least one foreclosure from 2007 to 2016. In Sherman Park and Washington Park, more than 3 out of every 10 houses were foreclosed on. Other parts of the city escaped practically unscathed. In the Upper East Side, fewer than 1-in-25 homes were foreclosed.

The map below shows the cumulative 2007-2016 foreclosure rate for each residential block in the city with at least 10 houses. Blocks shaded in blue experienced no foreclosures at all during the decade. The more than 500 blocks shown in the darkest shade of red experienced foreclosure rates of 32% or more. In 33 blocks, more than half of houses were foreclosed on between 2007 and 2016. And on the 2400 block of North 44th Street fully three quarters of homes—21 out of 28—received a foreclosure.
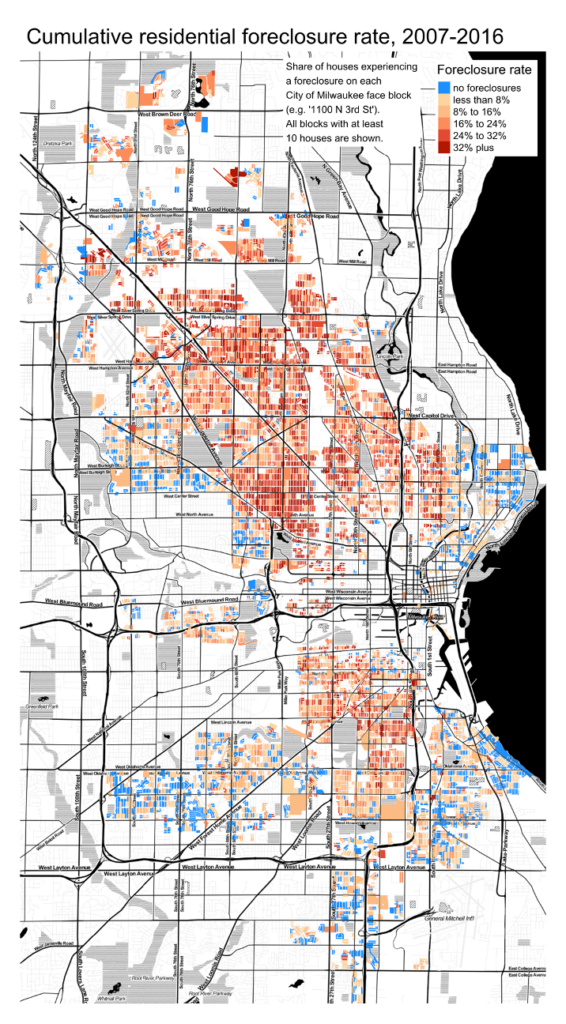
detailed map showing block level cumulative foreclosure rates from 2007-2016

Needless to say, the wave of foreclosures closely follows the declines in owner-occupancy since the Great Recession. Of all the properties which received a foreclosure between 2007 and 2016, 62% (over 13,000 homes) were owner-occupied at the beginning of the year in which the foreclosure occurred, according to city parcel data.

Often, foreclosed properties during this period were sold at auction or at bargain prices to cash buyers. Once outside the owner-occupied housing market, houses often remained held by investors. Since about 2018, several corporate landlords with private equity backing have assembled large portfolios in these neighborhoods, largely by consolidating the holdings of the smaller landlords who preceded them.

Foreclosures cast a long shadow, and the effects of the subprime mortgage crisis are still shaping many Milwaukee neighborhoods more than a decade after the Great Recession officially ended.

Data note

This foreclosure dataset combines several sources. Foreclosure records from 1995-2016 are sourced from an owner history dataset maintained by the Milwaukee City Assessor’s office. (Special thanks to Jeff Arp for his help). Records from 2017-2022 are from the Real Estate Transaction Returns filed with the Wisconsin Department of Revenue. I matched each source dataset to city parcel records, which allowed me to standardize addresses as well as identify the property type and ownership status at various points in time. In all likelihood, this dataset undercounts the true number of foreclosures because some foreclosure records could not be matched to parcel data or were otherwise missing.

Researchers and community groups are encouraged to explore the data for their own uses. Files are available at https://github.com/jdjohn215/milwaukee-foreclosures. Please direct questions to john.d.johnson@marquette.edu.

Continue ReadingNew dataset traces Milwaukee’s long foreclosure crisis

The Four Population Trajectories in Milwaukee County

The recent overall trends in Milwaukee county’s population are well known, but these headline figures obscure enormous variation between individual neighborhoods and suburbs.

Since 2000, the city’s population has declined a bit while the suburbs have, collectively, grown slightly. But within the city, neighborhood trajectories dramatically diverge, and population growth is really only limited to a specific set of pro-growth suburbs.

The graphic below categorizes census tracts into one of four demographic trajectories. “Building boom” neighborhoods (shown in dark blue) are building new housing and consequently increasing the number of households. In the city, this has mainly occurred in Greater Downtown (stretching from the north end of Bay View through the Lower East Side) as well as a cluster of subdivision-style housing developments on the far northwest side. All told, these areas have added 18,000 more residents since 2000, a 23% growth rate.

Glendale, Franklin, Oak Creek, Greenfield, and parts of St. Francis, Cudahy, and Wauwatosa have also grown thanks to new construction over the last 20 years. In total, the suburbs have added 23,000 residents in building boom tracts, a growth rate of 19%.

map and table showing the locations and statistics associated with the 4 population trajectories in Milwaukee county census tracts

Most people in either the city or the suburbs don’t live in a tract that’s building more units. Instead, they live in a neighborhood with few empty lots, where the number of occupied housing units has remained steady, but with a slowly declining typical household size. This combination inevitably leads to gradual population loss. These “stable decline” neighborhoods are shown in orange.

In Milwaukee, they cover much of Bay View, the west side, and the northwest side. In total these neighborhoods saw a population decline of 14,000, or 6%. The suburbs of Brown Deer, River Hills, Bayside, Fox Point, West Allis, Hales Corners, and Greendale all followed this trajectory as well. The suburban population in stable decline neighborhoods fell by 3,000, or 2%.

The flip side of “stable decline” neighborhoods are the more unusual phenomenon of population growth thanks to increasing household size. Shown in light blue, these neighborhoods are mainly found on the south side of Milwaukee, with a few additional clusters on the north side. Generally, this reflects the presence of immigrant families with typically larger household sizes. Despite not adding more housing units, these neighborhoods increased their population by 9,000, or 8%, since 2000.

In the suburbs, this growth pattern is mostly limited to Whitefish Bay, which managed to slightly increase its average household size over the past 20 years, no doubt aided by the popularity of its school district.

Adding these three kinds of neighborhoods—building boom, stable decline, and family-size driven growth—yields a population growth of about 13,000 in the City of Milwaukee over the past two decades. But Milwaukee didn’t grow over that period. It shrank. The reason is the remaining category, “Depopulation,” shown in red.

These are tracts which experienced a dwindling number of households along with high and/or growing vacancies. In some places more than 1-in-5 housing units are vacant. All told, the population in these tracts fell by 32,000 (21%) since 2000. The population is declining because many households choose to leave when they can, and few people replace them. It’s easy to understand why. These are also the neighborhoods with the highest racial segregation, asthma-related emergency room visits, incidents of childhood lead poisoning, mass incarceration rates, absentee landlords, building code violations, etc.

Encouraging population growth in Milwaukee will require different strategies for each neighborhood type.

The current strategy of dense infill development in Milwaukee’s downtown is paying dividends. Wherever construction has boomed, demand is high and vacancy rates are low.

That style of growth is ill-suited to the “stable decline” neighborhoods where there are few empty lots appropriate for large-scale redevelopment. Finding ways to restore the historic population density in these neighborhoods will require creativity and regulatory reform. Zoning density standards need to be reformed—for instance, by removing the lot area per dwelling unit minimum requirement.

The city should allow the construction of accessory dwelling units by right. These are already common in Milwaukee (we call them “carriage houses”), but they are illegal to build today. Allowing people to replace their garages with small dwellings or to install “in-law” suites in their attics or basements is a key way to help popular neighborhoods like Bay View and Washington Heights maintain the population density essential to their historic, walkable commercial districts.

Immigration, and correspondingly high family sizes, have been a valuable source of growth in some neighborhoods. Milwaukee should do whatever it can to encourage and support immigrants, who have always been a key pillar of the city. But the level of immigration we receive is largely a function of national policies outside our control, and, in any case, neighborhoods with large families today are still trending towards a status of stable decline as household sizes predictably shrink.

Even if Milwaukee accomplishes all these things—developing new apartment buildings, densifying in-demand residential neighborhoods, and encouraging immigration—we will still probably shrink. The main driver of population loss in the city is depopulation in neighborhoods where decades of disinvestment has caused low quality of life. Solving this will take much more than real estate development; although, building quality affordable housing will certainly play a role.

Milwaukee has the potential to grow a lot. Within the city we have relatively affordable housing, compared to much of the country. We have adequate natural resources and basic infrastructure to support many more residents. And much of the city is already growing. Whether due to new construction or immigration, about 40% of the city’s residents already live in a neighborhood that grew over the last 20 years.

Currently, that success is limited to specific neighborhoods. Creating broad-based population growth will require building more towers where land is available, adding density in built-out neighborhoods that already have high demand, welcoming more immigrants, and—most critically—making the depopulating neighborhoods on the near north side attractive places for existing residents to stay.

Continue ReadingThe Four Population Trajectories in Milwaukee County

New MMAC Leader Says, “We’re Going to Fight for the Whole Community”

What does Dale Kooyenga like about Milwaukee?

The question came from a member of the audience at a program at Marquette Law School’s Eckstein Hall on Tuesday (April 25, 2023). The questioner said she assumed that Kooyenga didn’t like Milwaukee because he was formerly a Republican member of the Wisconsin legislature who lives in the Milwaukee suburb of Brookfield. The way Republicans in the legislature have butted heads with Milwaukee leaders, generally Democrats, is a long-standing dynamic of Wisconsin politics.

But Kooyenga answered empathically that he shouldn’t be counted as part of that, not when looking at his past record and especially not when looking at his new role as senior vice president of the Milwaukee Metropolitan Association of Commerce. Kooyenga is expected to succeed the long-time president of the MMAC, Tim Sheehy.

For one thing, Kooyenga said, his state Senate district in recent years included some parts of the city of Milwaukee, and he was proud to represent the full district. For another thing, Kooyenga said, ask former Milwaukee Mayor Tom Barrett if Kooyenga was someone who Milwaukee leaders could talk to.

But, more broadly, Kooyenga had to pause before answering what he  likes about Milwaukee because, as he put it, “it’s a long list.” Recreational opportunities, spectator sports, the ease of doing things, the life his family is able to live, the diverse people of the metropolitan area, and, simply, the friendly character of Milwaukee and Milwaukeeans. Kooyenga said he grew up in Chicago and came to the Milwaukee area initially to go to college. He assumed he’d move back to Chicago as soon as he could. But he quickly decided Milwaukee was a great place to live — and he hasn’t left.

Furthermore, he said, don’t peg him in his new role by his partisanship in the past. “We’re going to fight for the whole community. . . . That’s important to me,” he said. “The MMAC will do what’s in Milwaukee’s best interest.”

Kooyenga said that for years, the MMAC has based its programs on four goals for the Milwaukee area: livability, growth, talent, and equity. He said the organization will continue to pursue those goals.

He praised Milwaukee Mayor Cavalier Johnson and Milwaukee County Executive David Crowley for the effort they are putting into building relationships with state leaders in Madison, including Republican legislative leaders. Their work will pay “huge dividends,” he said. And allowing local sales taxes to support government in Milwaukee – an idea that Johnson, Crowley, the MMAC, and others are supporting — “has to happen.”   

Kooyenga’s spoke at the first session of a new program of the Law School’s Lubar Center for Public Policy Research and Civic Education. Called “Get to Know,” the programs will be hosted by Derek Mosley, the new director of the Lubar Center, and are intended to provide a somewhat informal chance to meet interesting people involved in Milwaukee and the rest of Wisconsin.

The conversation with Kooyenga, Mosley, and members of the audience may be viewed by clicking below.

Continue ReadingNew MMAC Leader Says, “We’re Going to Fight for the Whole Community”