Marquette Law School Poll finds climate of reduced satisfaction with public schools in Wisconsin as new school year starts
MILWAUKEE — A Marquette University Law School Poll survey of registered voters across Wisconsin this summer found 46% of respondents expressing satisfaction with the public schools in their community, down from 63% in a poll asking the same question in October 2023.
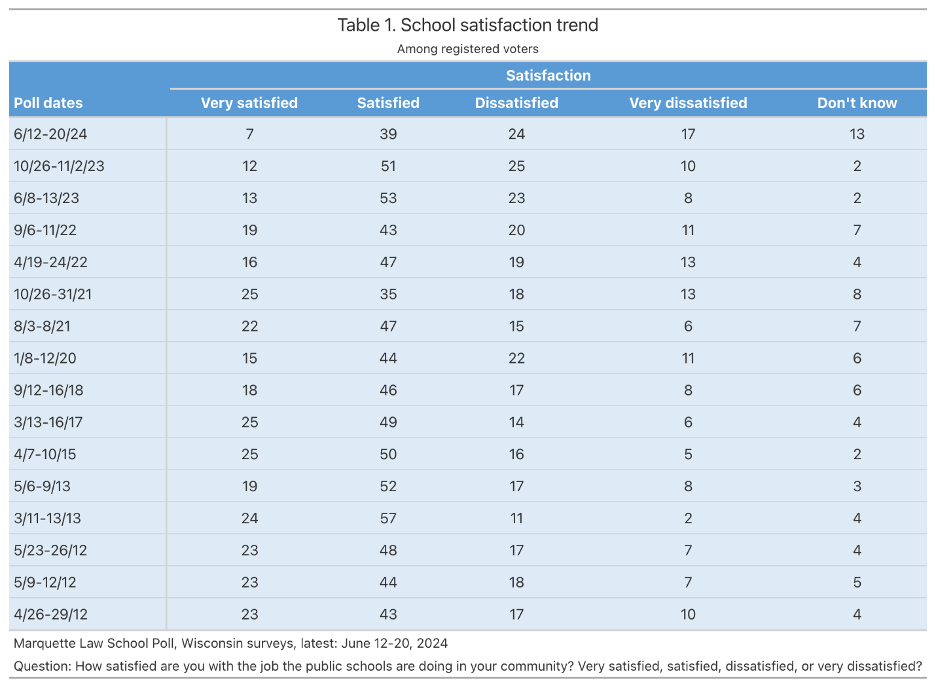
Seven percent in summer 2024 were “very satisfied” with their public schools, down from 12% last fall. In the latest poll, 39% reported themselves “satisfied,” compared to 51% last fall. This summer’s survey was conducted June 12-20, 2024, interviewing 871 Wisconsin registered voters, with a margin of error of +/-4.6 percentage points.
Overall, the June levels of satisfaction with public schools “in your community” were the lowest in any of the 16 Marquette Law School Poll surveys that have asked that question of Wisconsin adults, going back to 2012. Over the previous polls, before this survey’s 46%, the lowest satisfaction total was 59% (January 2020). That total included at least 15% who said they were “very satisfied” in each survey prior to 2023.
The June 2024 poll found 41% were dissatisfied with the public schools in their Wisconsin community, including 17% who said they were very dissatisfied. The dissatisfied percentage was the highest on record. Another 13% of those in this summer’s poll gave no opinion, a shift from previous surveys, which had not previously surpassed 8% without an opinion. The full trend in satisfaction with public schools is shown in Table 1.
All results in the tables are stated as percentages; the precise wording of the questions can be found in the online link noted above.
“The rise in dissatisfaction is seen across all regions of the state, but especially in the city of Milwaukee, where more than three-quarters reported dissatisfaction,” said Charles Franklin, director of the Marquette Law School Poll. In the latest poll, among those surveyed who live in the city of Milwaukee, 2% said they were very satisfied with the public schools, 20% were satisfied, 41% were dissatisfied, and 37% were very dissatisfied. In other parts of Wisconsin—including the rest of the Milwaukee metropolitan area, the Madison area, and the Green Bay area—between 51% and 56% expressed satisfaction, including 8% to 10% of voters who were very satisfied. Table 2 shows opinion by region.
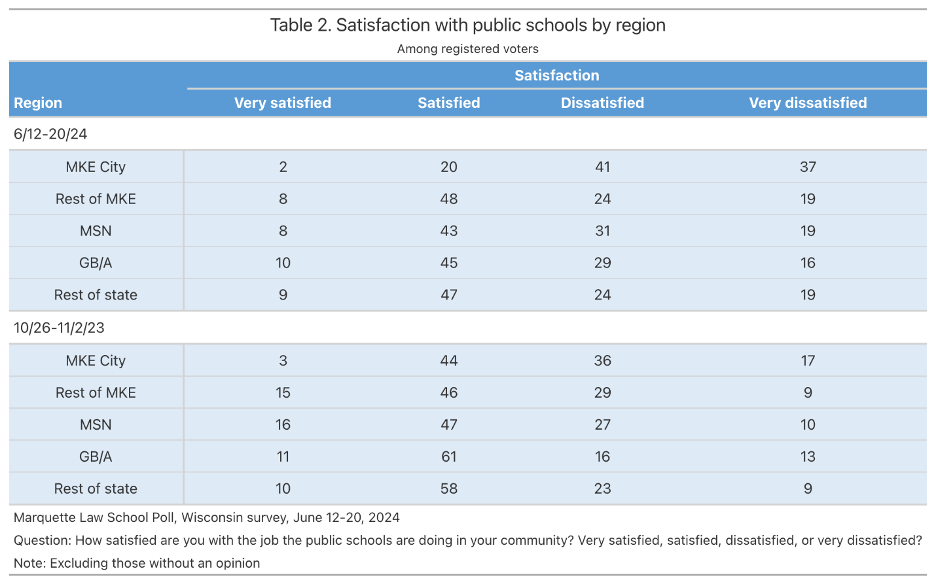
The survey in June was conducted while management issues for Milwaukee Public Schools were attracting major attention and the MPS superintendent had resigned abruptly, but dissatisfaction with public schools has been consistently higher over time in the city of Milwaukee than in the rest of Wisconsin. In the October 2023 survey, 3% of Milwaukee residents said they were very satisfied, 44% said they were satisfied, 36% were dissatisfied, and 17% were very dissatisfied.
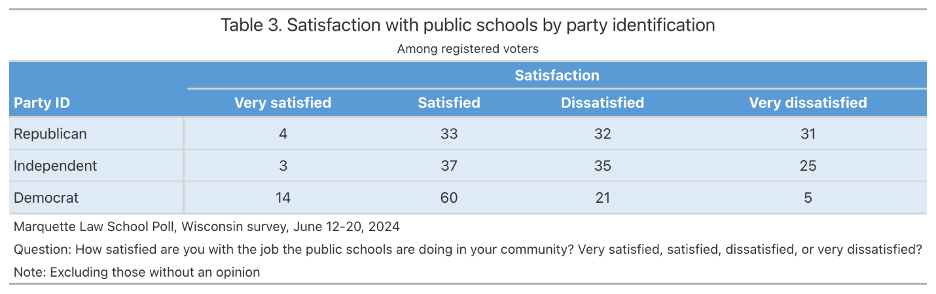
There was a large difference in the summer 2024 poll in satisfaction between Wisconsinites who identified as Republicans and those who identified as Democrats. Among Democrats, 74% said they were very satisfied or satisfied with their Wisconsin community’s public schools, while 26% were dissatisfied or very dissatisfied. Among Republicans in Wisconsin, 37% were very satisfied or satisfied, while 63% were dissatisfied or very dissatisfied. Only 5% of Democrats were very dissatisfied, whereas 31% of Republicans were very dissatisfied.
Franklin said the partisan gap in school satisfaction was modest in 2012 to 2020 and grew larger from 2021 to this year, which has seen the largest gap. Current satisfaction is shown by party identification in Table 3.
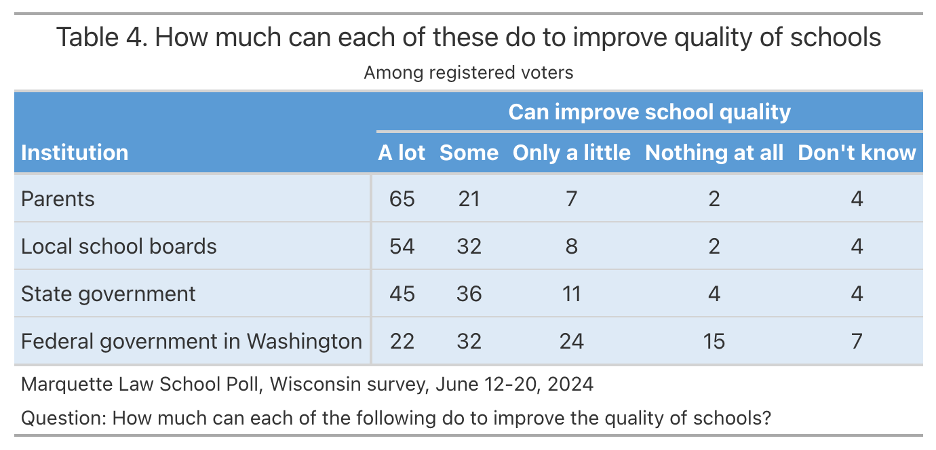
In June, more than 80% of Wisconsin voters felt that parents, local school boards, and state government could do a lot or do some to improve the quality of schools. Overall opinion was lower when it came to the question of how much the federal government could do to improve schools.
Specifically, 65% of the surveyed Wisconsin voters said parents could do a lot to improve schools and 21% said they could do some. As for school boards, 54% said they could do a lot and 32% said they could do some, while 45% said state government could do a lot and 36% said the state could do some. For the federal government, just 22% said it could do a lot and 32% said it could do some. These results are shown in Table 4.
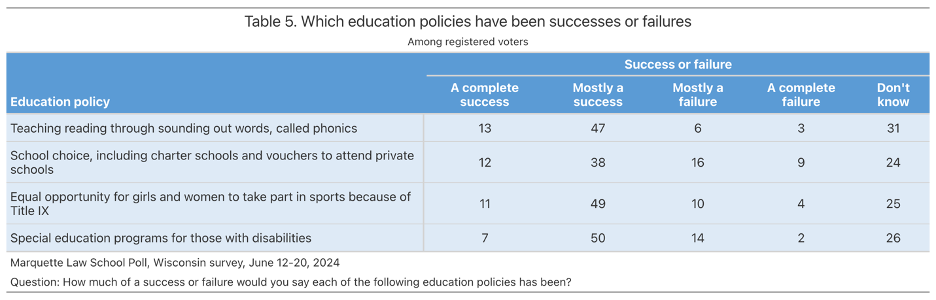
The survey asked whether people thought that four major educational policy developments in recent years were successful.
- For the use of phonics-based reading instruction, which emphasizes teaching students to sound out letters and words, 60% thought that it was very successful or successful, while 9% thought it was mostly a failure or a total failure. Another 31% said they did not know.
- Asked about school choice, 50% said that it was a complete success or mostly a success, while 25% said it was mostly a failure or a total failure and 24% said they did not know. The question did not define the term “school choice,” but it is often taken to focus on publicly funded vouchers for students to attend private schools.
- Federal legislation known as Title IX has been a total success or mostly a success in the opinion of 60% of those polled, while 14% said Title IX has been mostly a failure or a total failure. Another 25% said they didn’t know. Title IX bars discrimination in education based on sex and is best known for spurring major growth in girls’ and women’s sports programs over the past five decades.
- Finally, special education programs were regarded as a total success or mostly a success by 57% of those polled, while 16% thought such programs were mostly a failure or a total failure and 26% said they did not know.
About the Marquette Law School Poll
The Marquette Law School Poll is the most extensive statewide polling project in Wisconsin history. This survey was conducted June 12-20, 2024, interviewing 871 Wisconsin registered voters, with a margin of error of +/-4.6 percentage points.
The survey was conducted with a hybrid sample of 637 respondents selected from the Wisconsin voter registration list, and 234 selected from the SSRS Opinion Panel, a sample drawn from postal addresses across the state and invited to take part in surveys online. The interview was conducted online with 769 respondents and by telephone with a live interviewer with 102. Full details of the methodology are contained in the methodology statement at the link below.
The partisan makeup of the sample is 31% Republican, 29% Democratic, and 40% independent.
The entire questionnaire, methodology statement, full results and breakdowns by demographic groups are available on the Marquette Law School Poll website.