The summer 2026 issue of the Marquette Lawyer magazine has a number of entries concerning the Hon. Diane S. Sykes, L’84, including a set of one-page essays by seven different faculty on how their Marquette Law School courses draw on her writings as a judge of the U.S. Court of Appeals for the Seventh Circuit since 2004 or as a justice of the Wisconsin Supreme Court between 1999 and 2004. This is the last of the seven essays. The illustration of the faculty member, taken from the magazine and appearing here with the blog post, is by John Jay Cabuay.
 In Advanced Civil Procedure, an upper-level elective offered each spring, we have occasion to read all or parts of five opinions by the Hon. Diane Sykes. One we consider for its role in establishing the law, whereas the others we take up more for their exemplifying it. The distinction is familiar in the law: Some cases break ground or set precedent, while others are less well-known but useful for their representativeness of a doctrine or concept. Both sorts can be valuable in teaching and learning. In the Advanced Civil Procedure instances, perhaps it is not surprising that it is one of Justice Sykes’s decisions (i.e., from her time on the Wisconsin Supreme Court) that falls into the precedent-setting category.
Let’s start there. Yahnke v. Carson (2000) came toward the end of Justice Sykes’s first year of her half-decade tenure on the state Supreme Court. In a matter of summary judgment process (and substance) and with Justice Sykes writing for a majority, the court adopted what it termed “the so-called ‘sham affidavit’ rule.” The legal precept announced by the court may be less provocative than that phrasing, but it is still significant: “we hold that for purposes of evaluating motions for summary judgment pursuant to Wis. Stat. § 802.08, an affidavit that directly contradicts prior deposition testimony is generally insufficient to create a genuine issue of material fact for trial, unless the contradiction is adequately explained.” Just about every federal court of appeals had previously come out the same way interpreting the materially identical federal law (Fed. R. Civ. P. 56) on which Wisconsin modeled § 802.08. Yet the interpretation barely made it into Wisconsin law, as Yahnke was decided by a four-to-three vote, with Justice William Bablitch dissenting for himself, Chief Justice Shirley Abrahamson, and Justice Ann Walsh Bradley. In class, we find the Yahnke case valuable both for its specific rule and as an example of Wisconsin’s embrace of a number of summary judgment concepts found in the federal system.
The Seventh Circuit cases in Advanced Civil Procedure relevant here are less prominent but interesting all the same. Two of them are personal-jurisdiction cases. Northern Grain Marketing, LLC v. Greving (2014) involved a successful objection by a Wisconsin farmer to being sued in federal court in Illinois on a contract dispute with the plaintiff, Northern Grain. Greving lived very close to Illinois (just over the border, in Walworth County, Wis.) and had some connections with the state—but not the “minimum contacts with Illinois that would permit the district court, consistent with the due process clause of the Fourteenth Amendment, to exercise personal jurisdiction over him.” As Judge Sykes explained, “although it may seem convenient as a practical matter for Greving to defend this suit in Rockford, the Constitution doesn’t permit the Illinois courts—and, thus, [under Fed. R. Civ. P. 4(k)(1)(A)] federal district courts in Illinois—to exercise jurisdiction over him.” Judge Sykes’s opinion for the Seventh Circuit in Felland v. Clifton (2012) contributes to the law of personal jurisdiction in a different way: It has occasion to discuss how a court’s federal “minimum contacts” due process analysis can contribute to its consideration whether the requirements of a Wisconsin longarm statute (there, § 801.05(3)) are satisfied.
Finally (though early in the course), to demonstrate to the students an important way that the federal court system can connect with state supreme courts, we include brief excerpts from three Seventh Circuit opinions where a close question of state law was presented. In two of these cases, the federal court of appeals certified a question of state law to a state supreme court. Judge Sykes wrote these two opinions, seeking answers from the Illinois Supreme Court and the Minnesota Supreme Court. In the third instance, a diversity case where the Seventh Circuit had to sort out state law in a classic “Erie guess” or prediction situation (in fact, Wisconsin law), it didn’t even discuss the possibility of certifying to the Wisconsin Supreme Court. For the contrast of interest here, Judge Sykes was not part of the panel in this third case. Had she been, I imagine, the court might well have proceeded differently, certifying the question. Judge Sykes might have been more apt to recall Justice Sykes, we may say.
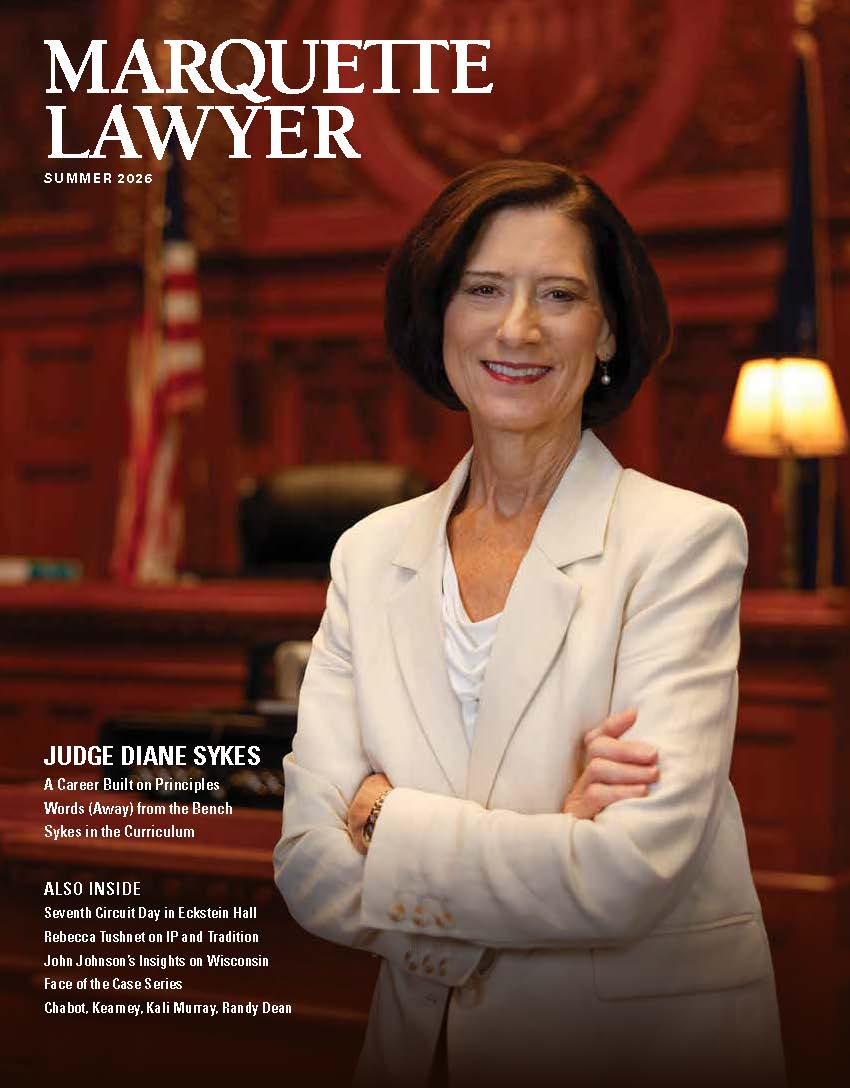 The Marquette Lawyer magazine often covers a broad range of important issues beyond the walls of the Law School. While this continues to be true in the new issue (Summer 2026), its contents also offer a propitious opportunity to draw readers’ attention—and, if we may, appreciation—to the faculty of Marquette Law School, as well as our alumni and supporters.