Who Lacks a Photo ID in Wisconsin?
Wisconsin has required residents to present a photo ID in order to vote in every November election beginning with 2016[1]. On April 1, voters will have the opportunity to add this requirement as an amendment to the state constitution. It will probably pass. The latest Marquette Law School Poll found 77% support for the ID requirement generally and 73% support for the constitutional amendment.
Supporters of the requirement argue that it’s a good way to prevent voter fraud. Opponents fear that it creates an onerous requirement for eligible citizens without IDs. During federal litigation following the bill’s passage an expert witness estimated that 300,000 then-registered voters lacked an appropriate identification card. Another witness ran a survey which found that 63,000 Milwaukee County residents likely lacked a state ID card.
To my surprise, I could find no more recent analysis of the number of Wisconsin adults lacking a photo ID card. This article is my attempt to answer two questions. How common is it for a Wisconsinite to lack a photo ID? Are there patterns in who lacks them?
Wisconsin Voter Turnout
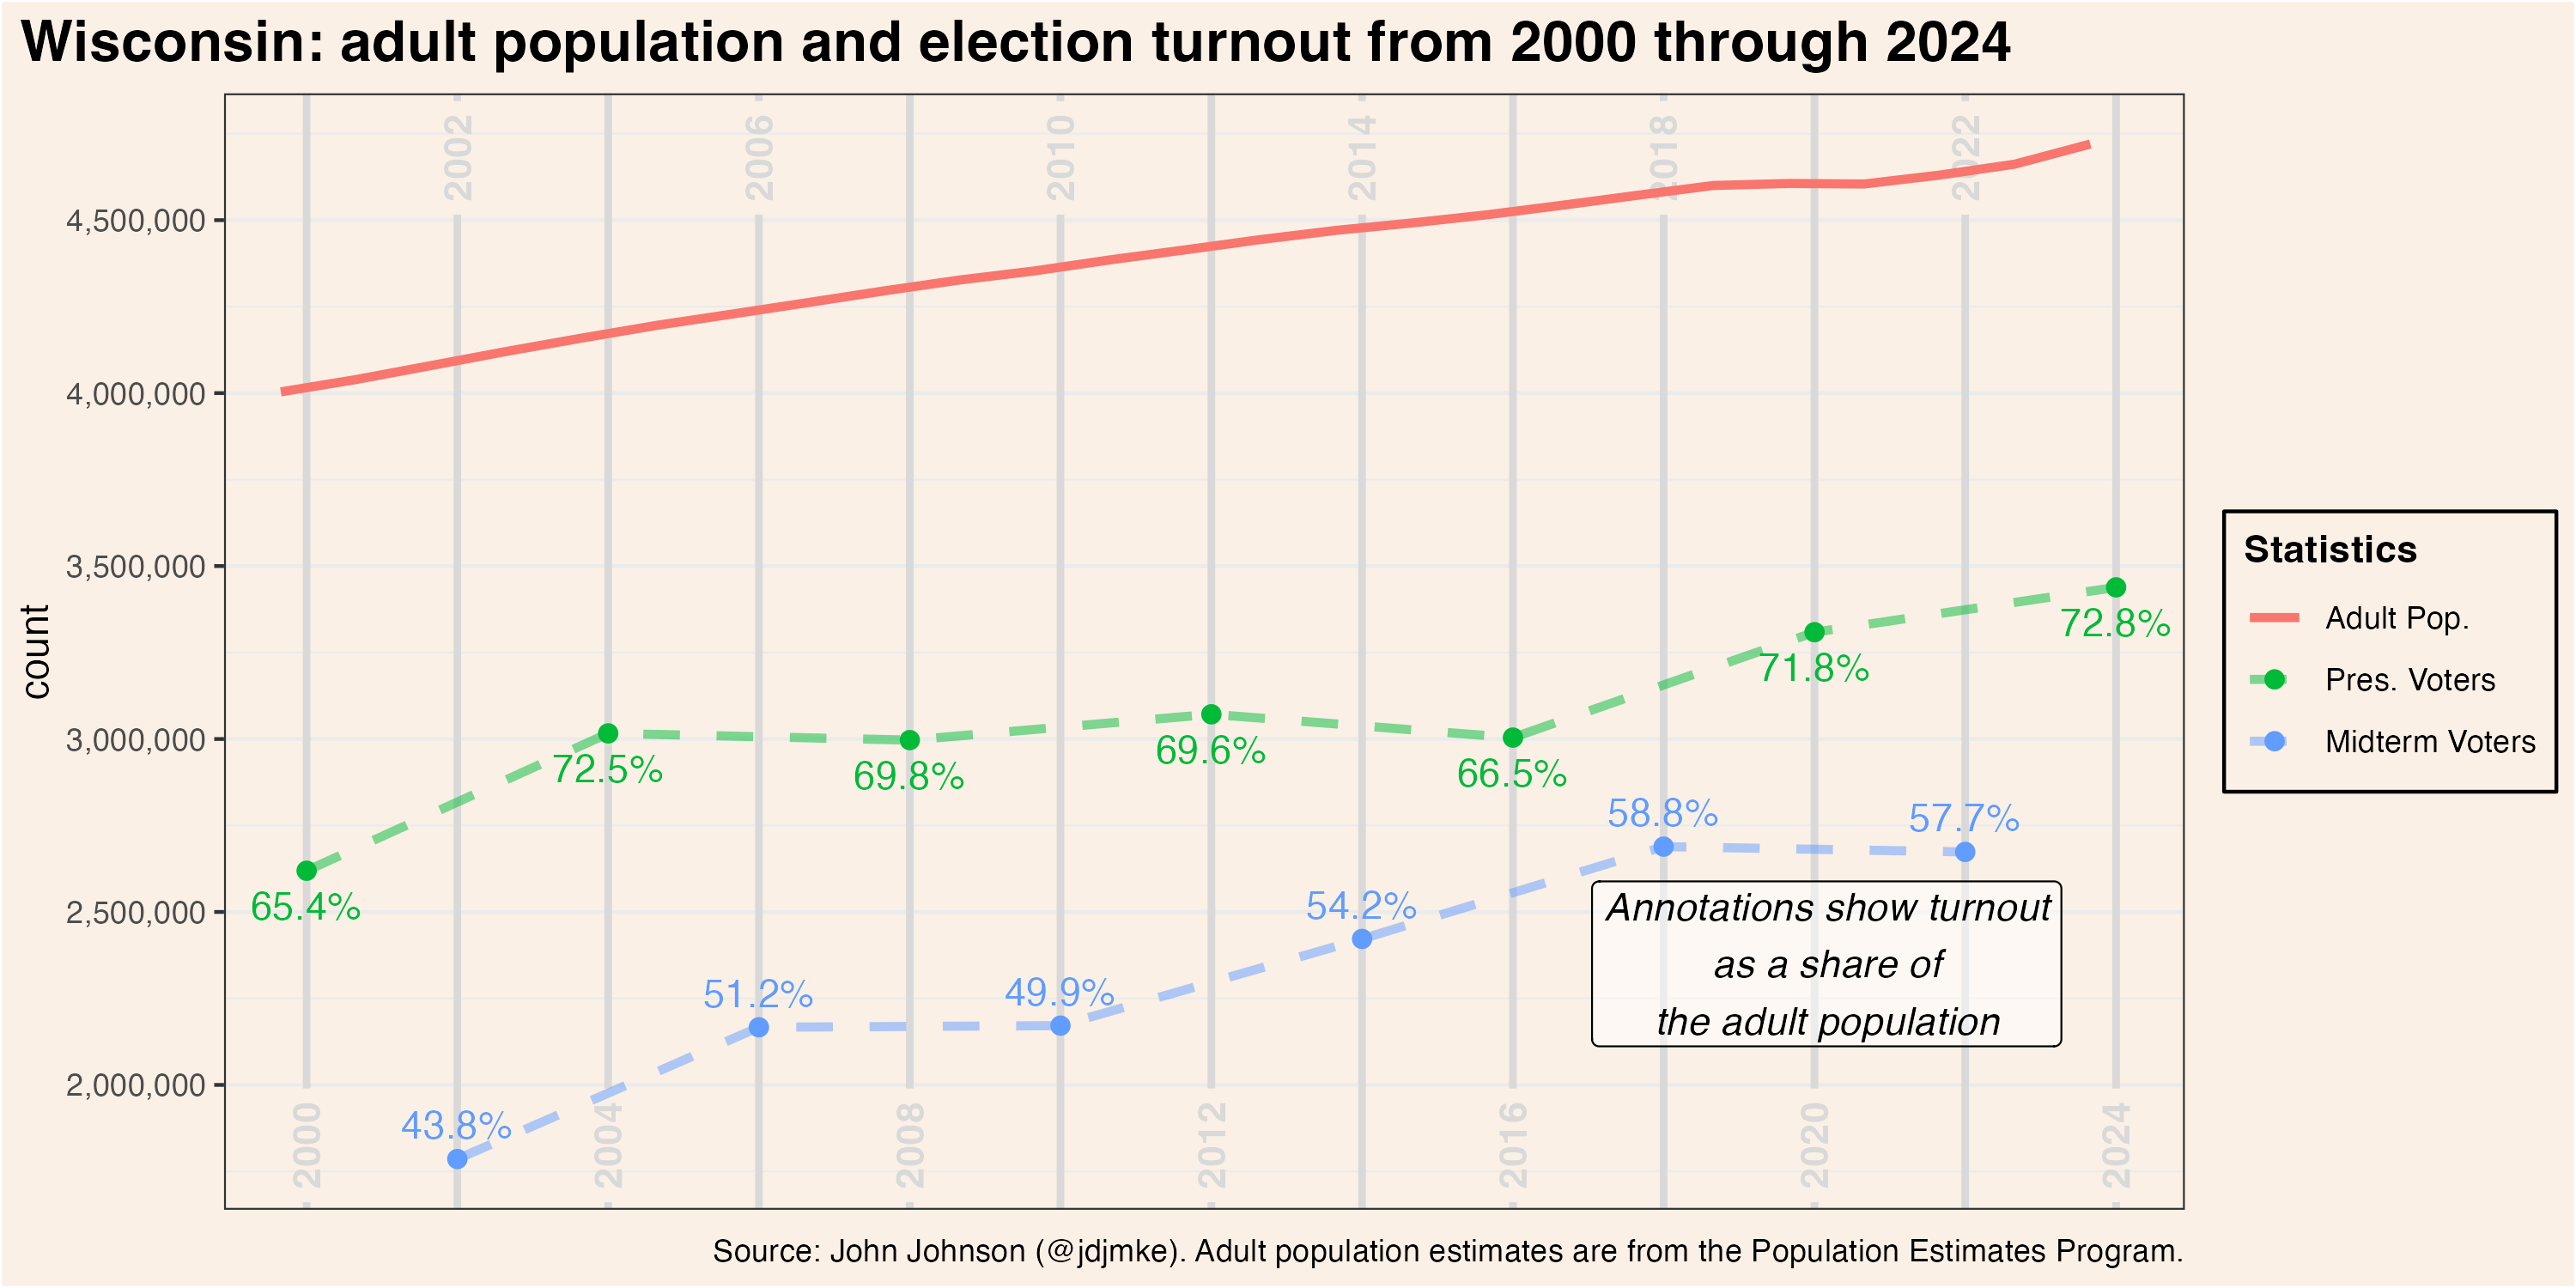
First, here are some basic facts about voter participation in Wisconsin. Turnout has consistently been very high in this state—typically among the highest in the country.
Opponents feared that the introduction of the photo ID requirement would reduce turnout. This does not appear to have happened, at least in a long-term way.
In 2008, 69.8% of adults voted. This fell ever-so-slightly to 69.6% in 2012. Then, turnout dropped much more noticeably in 2016, down to 66.5% of adults. Voters became much more engaged after Trump’s first election. Turnout jumped to 71.8% of adults in 2020.
Despite a national decline in voter turnout in 2024, it grew in Wisconsin to 72.8% of adults. Turnout was probably highest in Wisconsin out of all 50 states, whether measured as a share of all adults or voting-eligible adults.
Midterm voter turnout grew even faster than presidential turnout after the introduction of the photo ID requirement. Before the requirement, in 2010, 49.9% of adults voted. In 2014, 54.4% participated, growing to 58.8% in 2018. Turnout dipped to 57.7% in 2022.
Concerns about the impact of the photo ID law were particularly high in Milwaukee. Here, turnout dropped from 2012 to 2016 in presidential elections but grew in midterm elections from 2014 to 2018.
These overall turnout trends do not preclude the possibility that turnout would’ve been even higher in 2024 without a photo ID law. But they do imply a fairly low ceiling on the size of such an affect. The share of adults participating in Wisconsin’s democracy has probably never been higher than in the late 2010s and early 2020s, when they were also among the highest rates recorded by any US state since at least 1980.[2]
Current Photo ID Holders by Age
The circa 2011 estimates of people without a photo ID were mostly based on comparing the names in the registered voter database with the names in the DMV driver license database. That approach won’t work anymore, even if one had access to the DMV database (I don’t). Today, if you’re registered to vote in Wisconsin, you almost certainly also hold a photo ID.[3]
Instead, I obtained an aggregated dataset of ID holders by age from the Wisconsin DMV. It includes all kinds of IDs issued by the DMV (not just driver licenses). It does not include other permissible photo IDs, like tribal and student IDs.
My data shows the number of DMV photo ID holders in early 2025. In the chart below, I compare those totals for every year of age, 14 through 84, with our best estimate of the number of Wisconsin residents who were that age in January 2025.[4]
The number of ID holders is shown in red and the population estimate is shown in blue.
About 4% of 14 year-olds hold state ID cards, but the number increases rapidly with each subsequent teenage year. The number of 18 year-old ID card holders is 90% of the estimated 18 year-old population, and this grows to 98% among 24 year-olds. Recall, of course, that many of these young people are college students, and many student ID cards can be used to vote.

After age 24, something interesting happens in the data. Among those ages 25-42, the number of ID card holders noticeably exceeds the total population. The difference peaks at age 33, among whom there are 75,300 residents and 81,700 ID holders.
This excess in ID card holders is evidently the result of population mobility among young adults. The likelihood of moving out of Wisconsin peaks in the late-teens-to-early 30s. When such a person moves from Wisconsin to, say, Minneapolis, their existing ID card does not automatically or immediately expire.
Initial Wisconsin driver licenses last 2 years and renewed licenses expire 8 years after the recipient’s next birthday. So someone who renewed at age 20, then moved out-of-state after college graduation, would potentially be counted as a current Wisconsin photo ID holder until age 28, at least so long as they avoided getting a driver license in their new state.
Wisconsin participates in something called the “State to State (S2S) Verification Service,” along with 41 other states and the District of Columbia. This program alerts state DMVs when a person holding a license in one state receives a license in another (they match on SSNs). The goal is to prevent people from holding licenses in multiple states at once. Notably, Illinois is not a member of S2S (probably related to its still ongoing struggle to become real ID compliant). So Wisconsinites who move to Illinois will likely remain on the list of Wisconsin ID holders for longer than those moving into another neighboring state.

From the mid-40s onward, the number of DMV ID holders and the actual population converge. The degree of correlation is striking.
It’s not just that the general trends are similar. Even abrupt changes are matched in the two data sources. For example, the estimated population falls slowly between ages 75 and 77, sharply from 77 to 79, and slowly again from 79 to 80. This exact pattern is the same in both the population estimates and the ID counts.
| Age | Population Est. | ID Holders # |
| 75 | 53,600 | 53,700 |
| 76 | 50,100 | 50,700 |
| 77 | 49,600 | 49,800 |
| 78 | 42,300 | 42,500 |
| 79 | 33,300 | 33,800 |
| 80 | 32,100 | 32,300 |
Notice that the number of ID holders still slightly exceeds the population for each age. This reflects, I believe, an unavoidable delay in processing death certificates plus the continued effect of IDs expiring after their holder has left the state.
How Many Adults Lack an ID?
What we’d really like to know is the number of valid DMV ID cards held by a current resident of Wisconsin. . Nobody knows this statistic, but we can estimate its lower bound.
Each year, the Census Bureau estimates the number of people who moved out of Wisconsin in the previous year.[5] It bounces around a bit from one year to another, but typically about 10,000 18 or 19 year-olds and 83,000 adults age 20 or older leave the state.
Standard licenses last for 8 years after your next birthday and initial (or “probationary”) licenses last for two. Knowing this, we can estimate how many recent movers would hold an unexpired Wisconsin ID, if that ID remained valid until its scheduled expiration date.
For the purposes of this calculation I assume that every 18 or 19 year-old mover held a probationary license and every other adult held a full driver license (an overestimate, no doubt). I further assume that people leaving Wisconsin do so randomly with regard to their ID card’s expiration date. Someone leaving the state is equally likely to hold an ID card that they renewed 1 year ago as they are to hold a card expiring in 1 year.
Consequently, I estimate that three quarters of the 76,000 people (age 20 and older) who left the state 2 years ago still hold a DMV ID card that has not yet reached its printed expiration date.
Adding up each year’s fraction of the movers still holding an “unexpired” ID, I get an estimate of 304,000 “unexpired” DMV ID cards actually belonging to someone who no longer lives in Wisconsin.
Subtracting this number from the count of adult DMV IDs, we get 4.43 million ID card holders, or 94% of the state’s adult population of 4.72 million. By this measure, 290,000 adults (6%) would lack a DMV-issued ID card.
Of course, this is the outer boundary of estimates for the non-ID-having population. The actual number must certainly be lower—possibly much lower—thanks to Wisconsin’s participation in the S2S system.
When our hypothetical twenty-something moves to Minnesota after college, their Wisconsin ID will only last until they receive a Minnesota ID to replace it. How long they wait before applying for this ID is unknown. I can find no statistics from the S2S system reporting the number of matches they process.
And we have the issue of Illinois. The Census Bureau estimates that 14,000 people (of any age) made the move from Wisconsin to Illinois in 2023. Thanks to Illinois’ lack of participation in the S2S system, these movers are probably more likely to remain on the books in Wisconsin.
All of this is to say, the plausible share of adult Wisconsin residents without a DMV-issued ID lies somewhere less than 100% and greater than 94%.
What Predicts Fewer ID Holders?
The population without a DMV ID card is evidently small, but it could be concentrated among particular groups of people. To measure this, I designed a linear regression model predicting the ratio of ID holders per 100 adults in each census tract. The dependent variable is adult ID holders as a percentage of the adult population and the independent variables are listed with their coefficients in the table.

Naturally, the largest predictor of more IDs is movers out of Wisconsin. For every 1 percentage point increase in the share of the population who left Wisconsin in the previous year, the number of IDs per 100 grows by 1.6.
The opposite is also true. If more people in the tract are recent arrivals to Wisconsin, the tract has fewer ID cards. As expected, ID cards are also less common in places with more college students and 18-19 year-olds. (Some of these will have student IDs that allow them vote.)
More concerning is the effect of poverty. The number of IDs per adults declines by 0.24 with every 1 point increase in the share of adults living below the poverty line.
A 1-year increase in the median age has a similarly-sized positive effect in increasing the number of ID holders.
All else being equal, a 1 percentage point increase in the Black and Asian populations is associated with 0.27 and 0.18 point increases, respectively, in the share with a photo ID.
Conclusion
The great majority of Wisconsin adults hold a photo ID card from the DMV. The total number of ID holders exceeds the adult population because ID cards often expire years after the holder moved out of the state. After estimating the number of unexpired IDs attributable to those who’ve left the state, I estimate that fewer than 6% of adult Wisconsin residents may lack a DMV photo ID card.
A regression analysis suggests that the adults least likely to hold an ID card are those in their late teens, college students, and new arrivals to the state. College students commonly receive photo IDs which can be used to vote and new arrivals likely just haven’t gotten around to updating their DMV registration.
This leaves young adults who aren’t enrolled in college and adults living in poverty as the two groups most likely to be harmed by the photo ID requirement for voters.
Wisconsin’s voter turnout rates have continued to climb since implementing a photo ID requirement for voters prior to the 2016 election. In 2024, Wisconsin actually had the highest voter turnout rate in the nation. This likely reflects government efforts to make voter ID cards freely available with minimal paperwork, and successful efforts to help more people apply for those cards. Nonetheless, it remains the case that young and poor people are less likely to have a photo ID, though this is not true of racial minorities according to the regression analysis.
[1] The law was originally passed in 2011, but it underwent extensive state and federal litigation that prevented its use in the 2012 and 2014 general elections. See this timeline for more details.
[2] See voter turnout rates as a share of the voting age population published by Michael McDonald.
[3] One must present proof of residence in order to register to vote, which could be a current photo ID but could also take the form of, e.g., a utility bill. A photo ID is only required in order to request a ballot. Wisconsin’s voter roll maintenance stipulates that, following each general election, postcards are mailed to every registrant who hasn’t voted in the past four years. If the registrant fails to return the postcard, they are struck from the voter rolls. So, technically, it would be possible for someone without a photo ID to register to vote, never actually cast a ballot, but remain on the voter rolls by faithfully returning the maintenance postcard every two years.
[4] I leave the 85+ population off the graph because that population estimate is given as a total and not by single year of age. The relationship of IDs to population is the same for this age bracket as for other older adults. After adjusting the 2023 population estimates for age specific mortality rates, I estimate that 120,800 adults age 85 and older lived in Wisconsin in January 2025. At that time, there were 121,500 DMV IDs issues to people in the age bracket.
[5] These numbers are collected by the American Community Survey (ACS). The 2024 estimate is unavailable, so I substituted the average of 2022 and 2023. No 1-year estimates were published for 2020 (due to pandemic disruptions to data collection), so I substituted the average of 2019 and 2021.