Popular Supreme Court Decisions, Inflation Pessimism, and other Themes from the July Marquette Law School Poll
Plus 1k adults share their biggest concerns about the country
The latest national survey from the Marquette Law School Poll is out now. Here are just a few of the interesting results we found. For more, read our press release about national politics here, our Supreme Court press release, or our complete topline and crosstab tables. At the last link you’ll also find our new Trend Toplines file, which includes tables and graphs showing how the responses to each question have changed over time.
The Supreme Court’s decisions were popular this term.
Majorities of adults favored the Supreme Court’s rulings in all 7 of the major cases we asked about from the past term.
- Uphold TX law requiring proof of age to access adult websites: 75% favor
- Require due process for those subject to deportation: 73% favor
- Uphold TN ban on transgender treatment for minors: 71% favor
- Allow parents to opt school children out of lessons: 71% favor
- Uphold law requiring TikTok sale: 60% favor
- Require religious tax exemption for Catholic Charities: 59%
- Limit district court use of nationwide injunctions: 56% favor
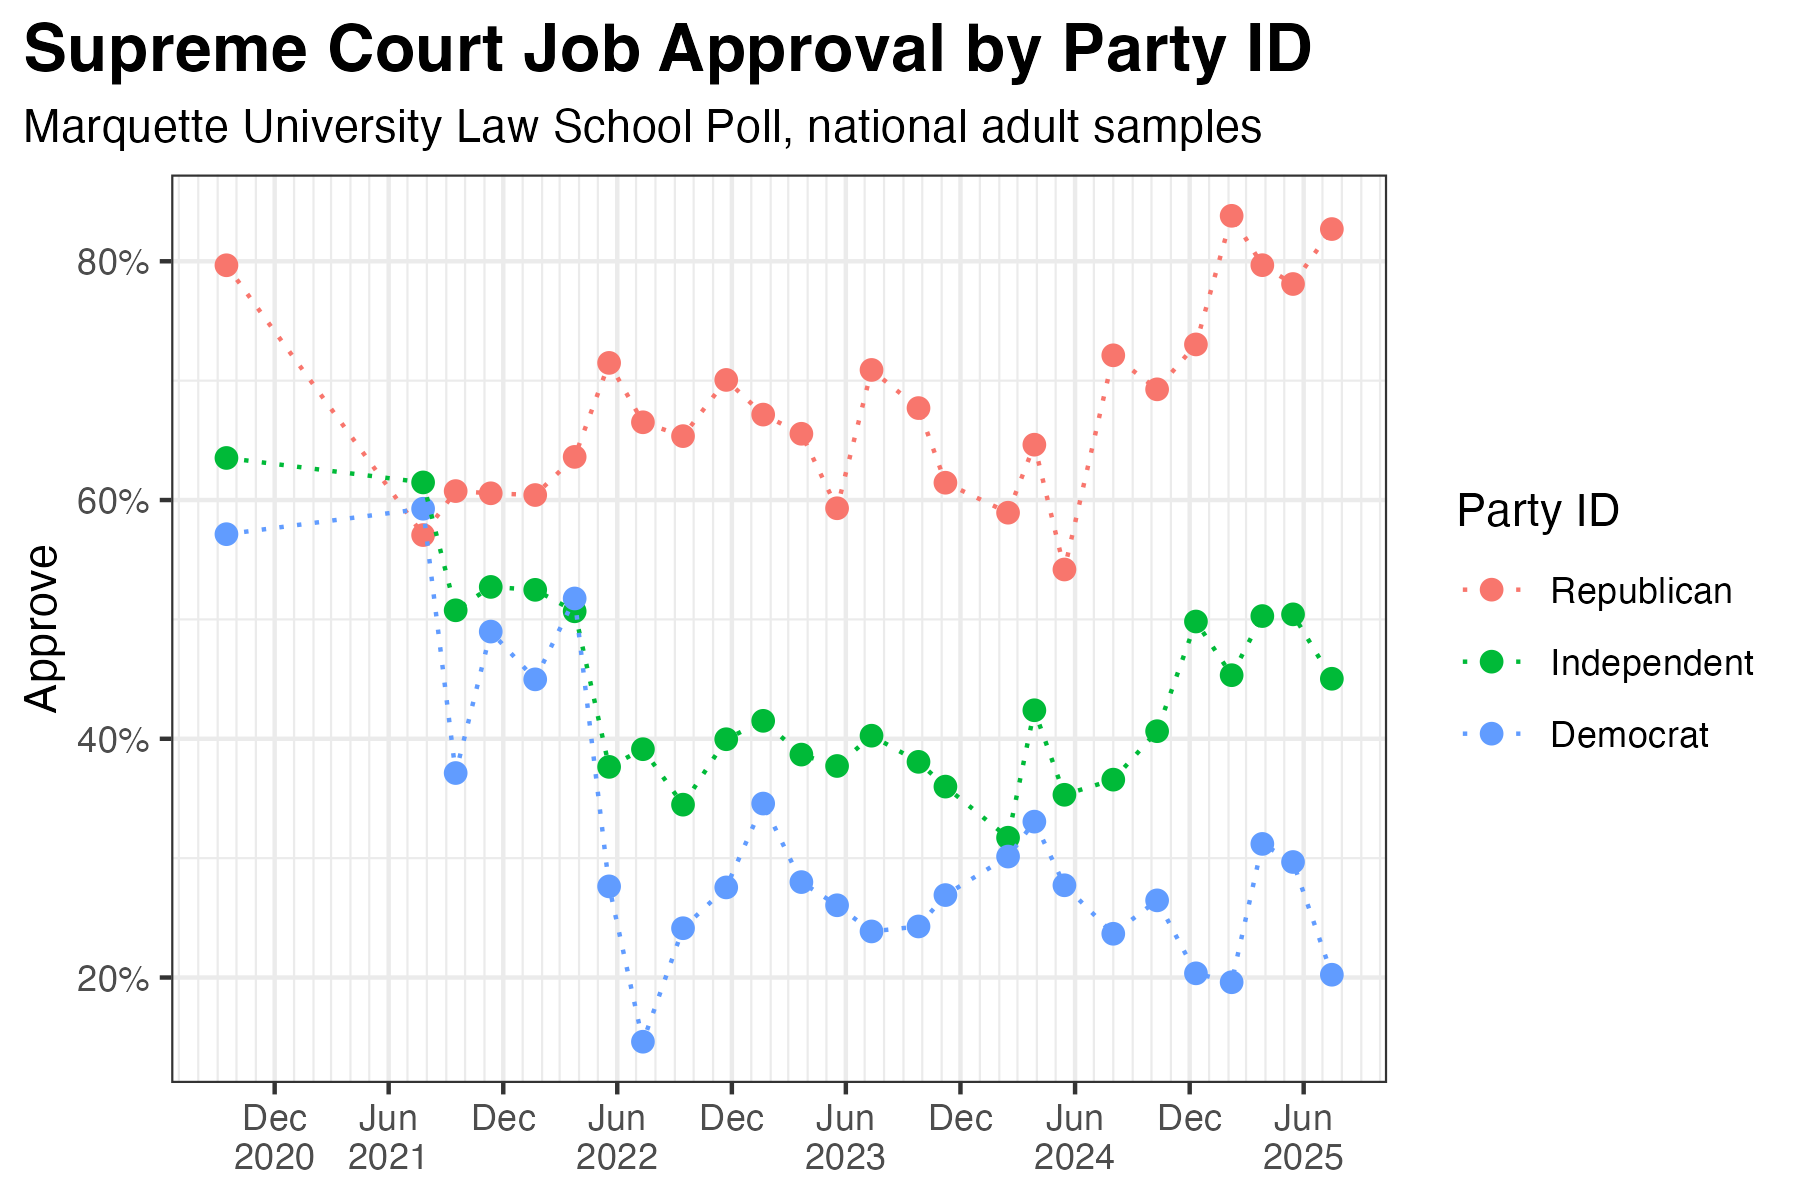
Overall, 49% approved of the Court’s job performance and 51% disapproved. This is a four-point drop in those approving, driven by a large (13-point) drop-off among Democrats.
Back in the summer of 2021, the parties scarcely differed in their views of the court. This changed rapidly, particularly following the Dobbs decision overturning Roe v Wade. In the latest poll, 83% of Republicans approve of the Supreme Court’s job vs 20% of Democrats and 45% of independents.[i]
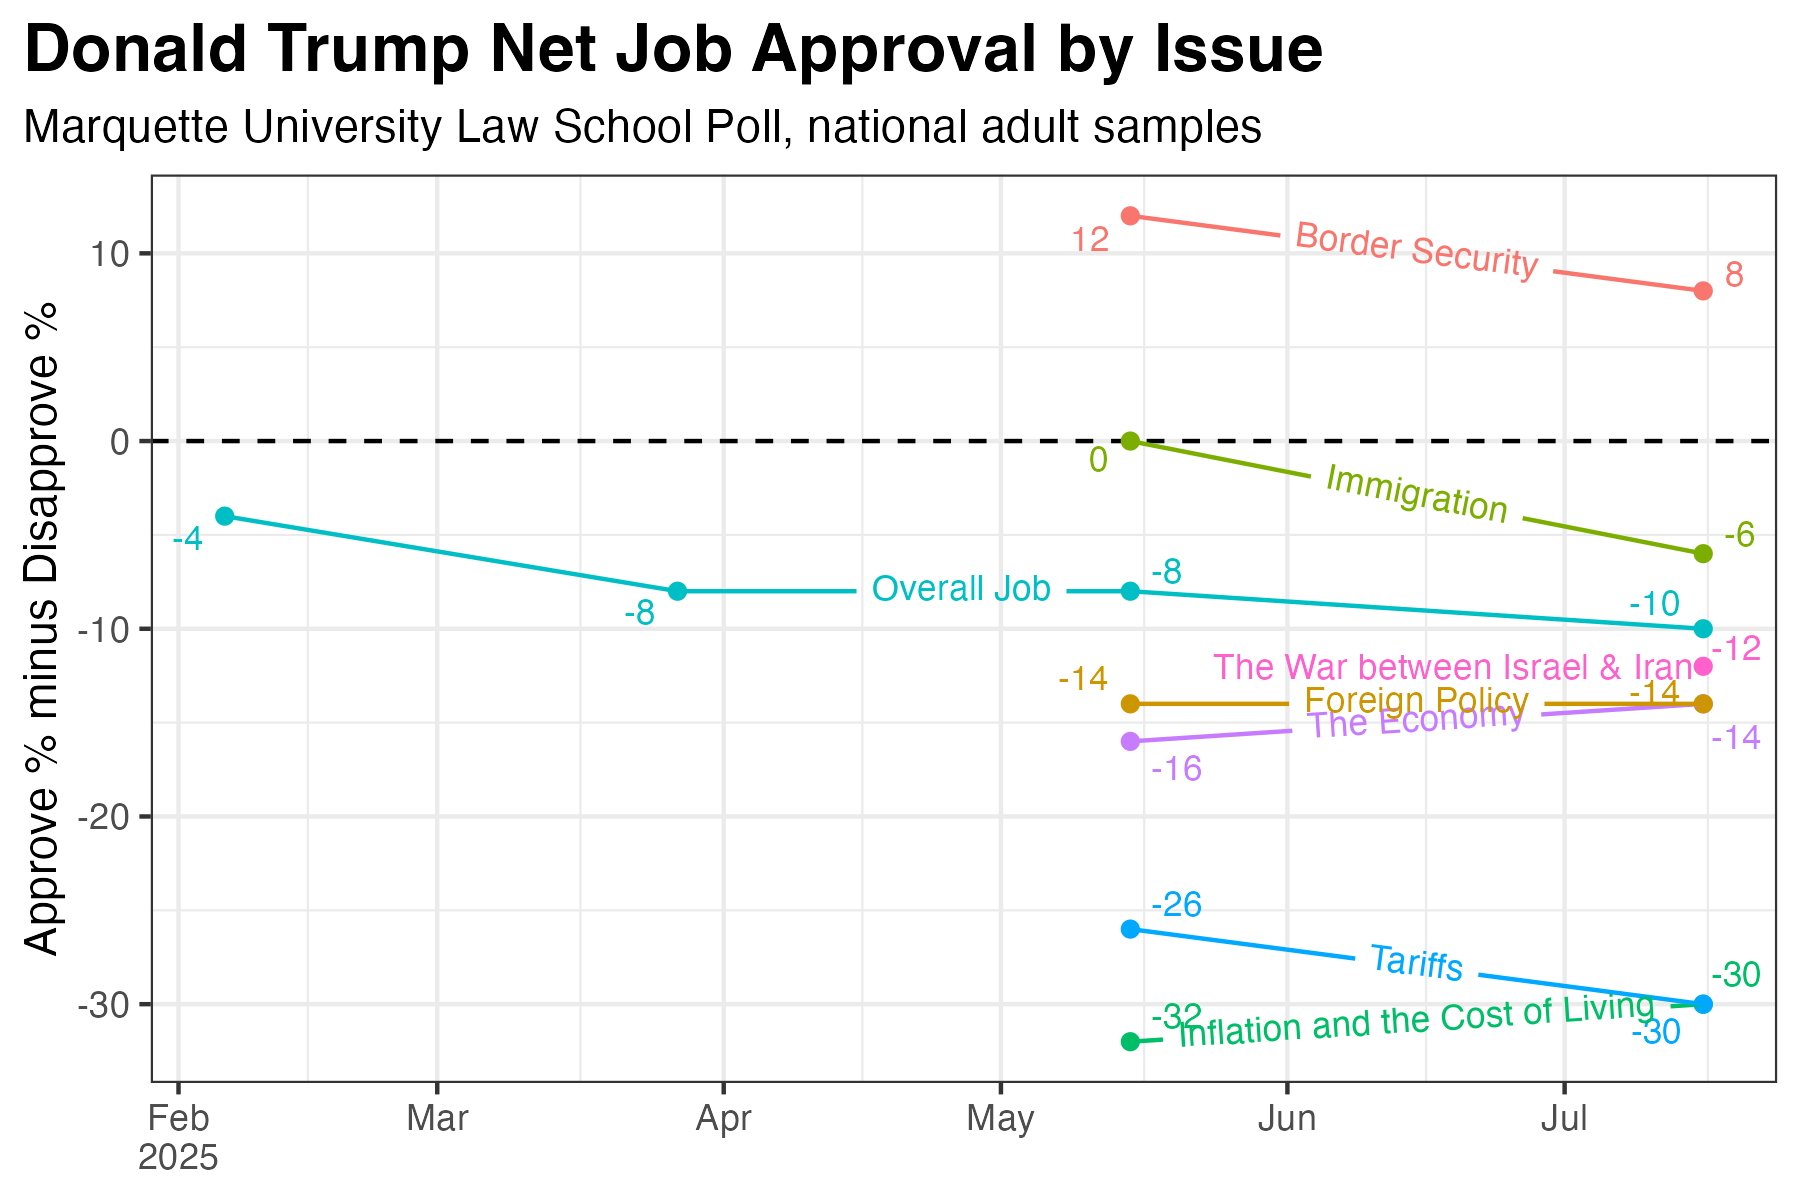
Trump’s overall job approval is stable but varies a lot by topic.
Approval of Trump’s job performance ranges from +8 on border security to -30 on tariffs, inflation, and the cost of living.
Pessimism about inflation
Opposition to immigration and frustration with high inflation helped elect Trump in 2024, and initially Trump enjoyed support for his policies on both these issues.
In December 2024, shortly after winning the election, 81% of Trump voters anticipated that his policies would decrease inflation. This fell to 75% in February, 67% in March, 59% in May, and 58% in July.
Among all adults in July, just 28% believe Trump’s policies will decrease inflation and 60% expect an increase. 65% percent predict that “inflation and the cost of living will increase” over the next 12 months, while just 18% expect it to decline.
Support for deportations is waning
Since early 2024, we’ve asked “Do you favor or oppose deporting immigrants who are living in the United States illegally back to their home countries?” Phrased this way, support for deportations grew after Trump’s election, reaching 68% favoring deportations in March with 32% opposed. In July, support for deportations fell to 57% with 43% opposed.
Views on deportations are highly dependent on how the question is phrased. Throughout this period, we have also asked, “Do you favor or oppose deporting immigrants who are living in the United States illegally back to their home countries even if they have lived here for a number of years, have jobs and no criminal record?” Put this way, support for deportations has never exceeded 44% and stood at 38% in July 2025.
Most people (55%) think the U.S. is “mostly deporting immigrants who have no criminal records,” while 45% believe mostly immigrants with criminal records are being deported. July is the first time we’ve included this question.
Themes in open-ended responses
Unlike our Wisconsin state polls, all survey respondents complete our national polls online. This allows us to ask open-ended, free-response questions. Since December, we’ve asked, “What do you [like/dislike] about Donald Trump?” In July, we added a new question. “What is your biggest concern about the country these days?”
You can read, search, sort, and filter all 1,005 responses at this link. This is an exercise I find invaluable in understanding what voters (and non-voters) are actually thinking.
Here are a few of my impressions from the free responses:
- The balance of open-ended responses has shifted modestly against Trump, tracking his slow decline in overall job approval. In December 2024, 51% named things they both liked and disliked about Trump, while 12% didn’t dislike anything and 35% didn’t like anything. In July, a similar number, 49%, list likes and dislikes, but the those who don’t like anything grew to 40% and those who don’t dislike anything fell to 8%.
- If I had to describe the content of the “biggest concern” question in one word it would be “fear” or “anxiety” even more so than “anger,” which was also present in many responses.
- Ninety-one people spontaneously mentioned going to war as among their top concerns for the country.
- Many answers described social divisions and frustrations with other Americans. Elsewhere in the survey, 56% said that “generally speaking, most people can’t be trusted.” This is the highest level mistrust we have measured in 24 surveys going back to September 2021. Our open-ended explorer tool allows you to filter answers by the respondent’s level of trust in others.
- Over 90 people spontaneously mentioned something related to immigration, ICE, or deportations as among their biggest concerns. Of these, 58% were generally supportive of Trump’s policies, 31% were opposed, and the views of 11% were unclear or unclassifiable.
- 13 people, 11 of them Republicans, spontaneously mentioned Jeffrey Epstein, always in criticism of Donald Trump. Our survey was in the field from July 7-16, with most interviews completed by July 9th. The Department of Justice published its memo ending the Epstein investigation on July 7th.
[i] These figures are for unleaned party ID, where independents who lean to a party are still counted as independents. The press release shows figures for leaned party ID. I use the unleaned party ID in this graphic because it has a longer time series.