New research investigates the cost of housing in the Milwaukee metro
The Lubar Center’s latest research project takes a careful look at how housing affordability has changed in the Milwaukee metro in the early 2020s.
Our article, “Can a typical worker still buy a house in the Milwaukee metro? Increasingly, no,” was published in the Milwaukee Journal Sentinel on October 9, 2024. Journal Sentinel business reporter Genevieve Redsten also contributed an article to the series, “Homeownership is less attainable in the Milwaukee area. Why new construction hasn’t been part of the solution.“
Our research uncovered much more than could fit in a single story. We have shared additional resources in this web report. It includes more methodological details about our calculations and statistics for individual municipalities in the four-county Milwaukee area.
Previously, we’ve written about how the subprime mortgage crisis and the end of the residency requirement contributed to plummeting owner-occupancy rates in the City of Milwaukee. Home values fell to very low levels in Milwaukee, while rents remained relatively elevated. Consequently, home-ownership was far more cost effective than renting for many families. Meanwhile, rents–particularly in poor neighborhoods–were quite profitable. This profitable potential eventually brought Milwaukee (and similar rust belt cities) to the attention of private equity-backed corporate landlords in the late 2010s and early 2020s.
Those same years saw owner occupancy finally begin to recover in Milwaukee. Owner-occupancy grew slightly in 2019, the first year-over-year increase since 2005. These circumstances combined to foster fierce competition between would-be homeowners and out-of-state investors, particularly in majority Black neighborhoods on the city’s north side.
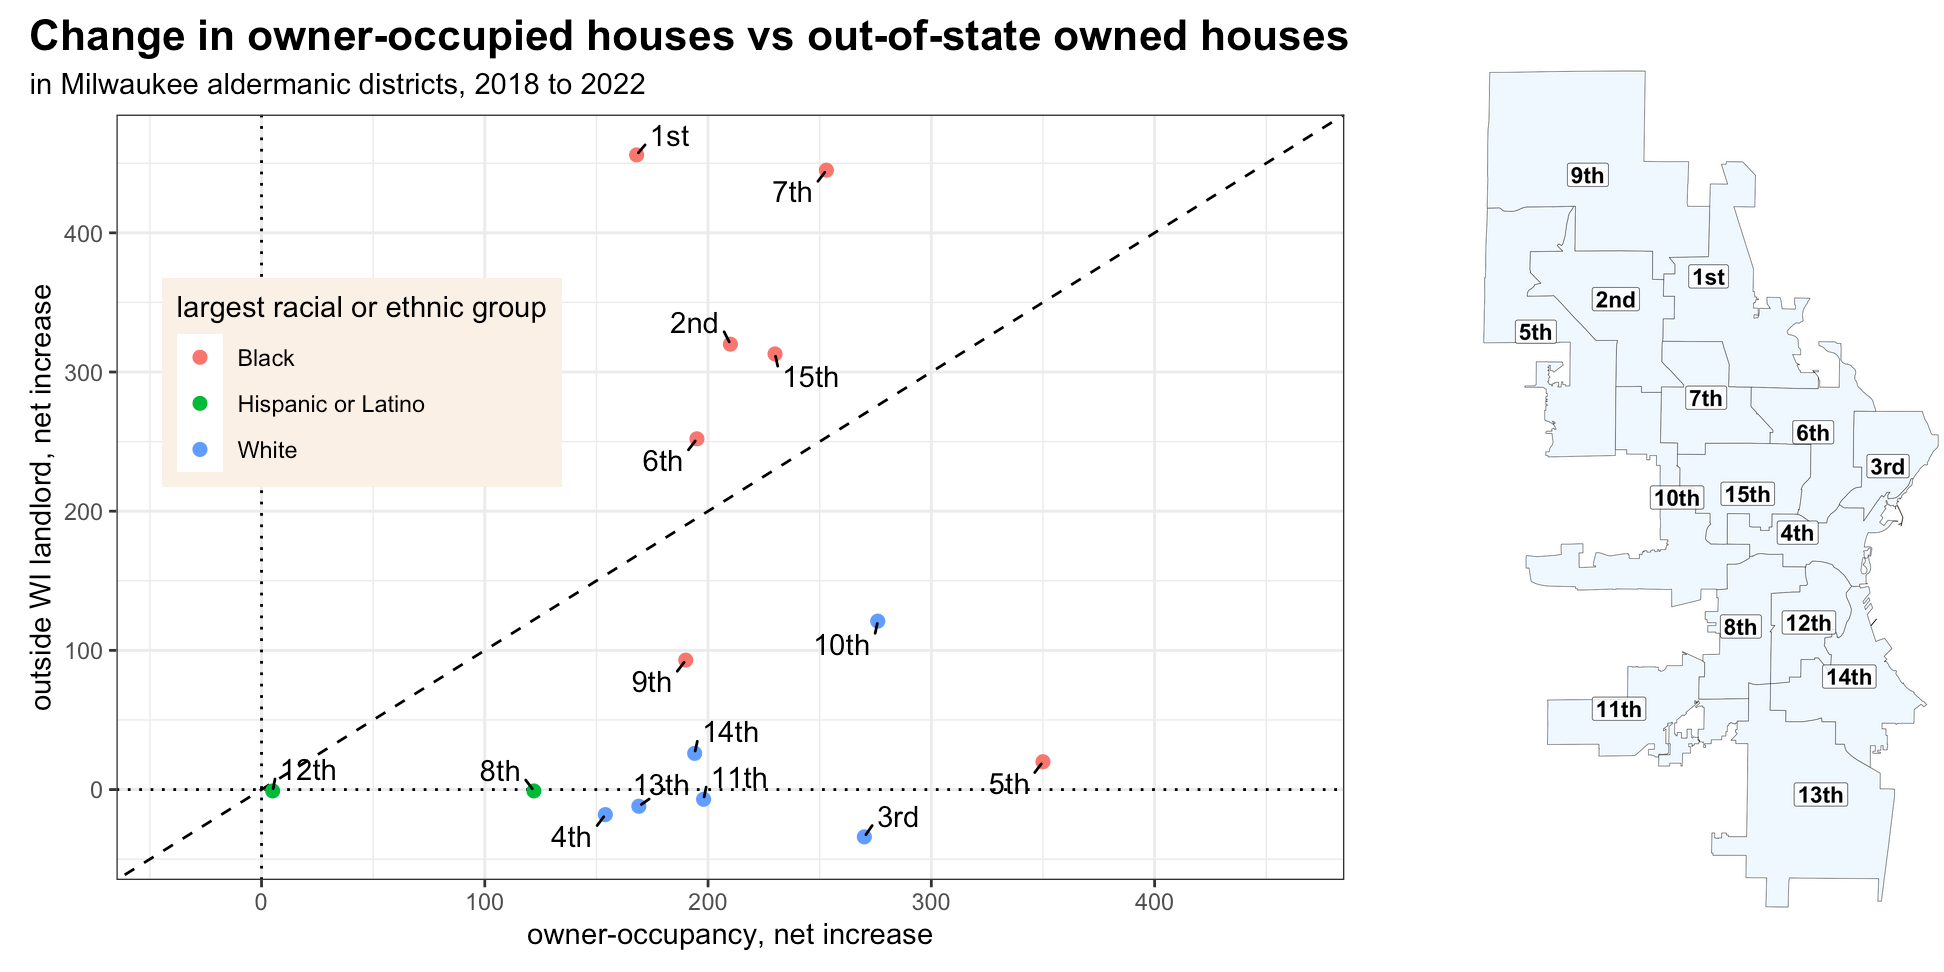
Since 2022, the market has cooled off. Home prices are still sky high, and increased interest rates have driven the monthly cost required to buy a house even higher. But high interest rates have also changes the calculus of corporate investors. All three of the large private equity backed firms operating in Milwaukee’s rental market have stopped buying and started selling in the past two years. For the first time since the subprime mortgage crisis began, the net number of homes owned by an out-of-state landlord actually declined in the City of Milwaukee during 2023, and that slight decline continued into the beginning of 2024 as well.
Net levels of owner-occupancy continued to grow in 2023 and 2024, albeit at a much slower pace than the preceding several years. It’s no wonder why the market has cooled. Owner-occupancy is far less attainable for many workers, as our latest article discusses in detail. Also, the cost-benefit analysis of owning a home versus renting has shifted. In 2020, we calculated that a typical single family home was cheaper to own than rent, even when factoring in the same kinds of maintenance cost assumptions used by professional property managers. That is no longer true in 2024.
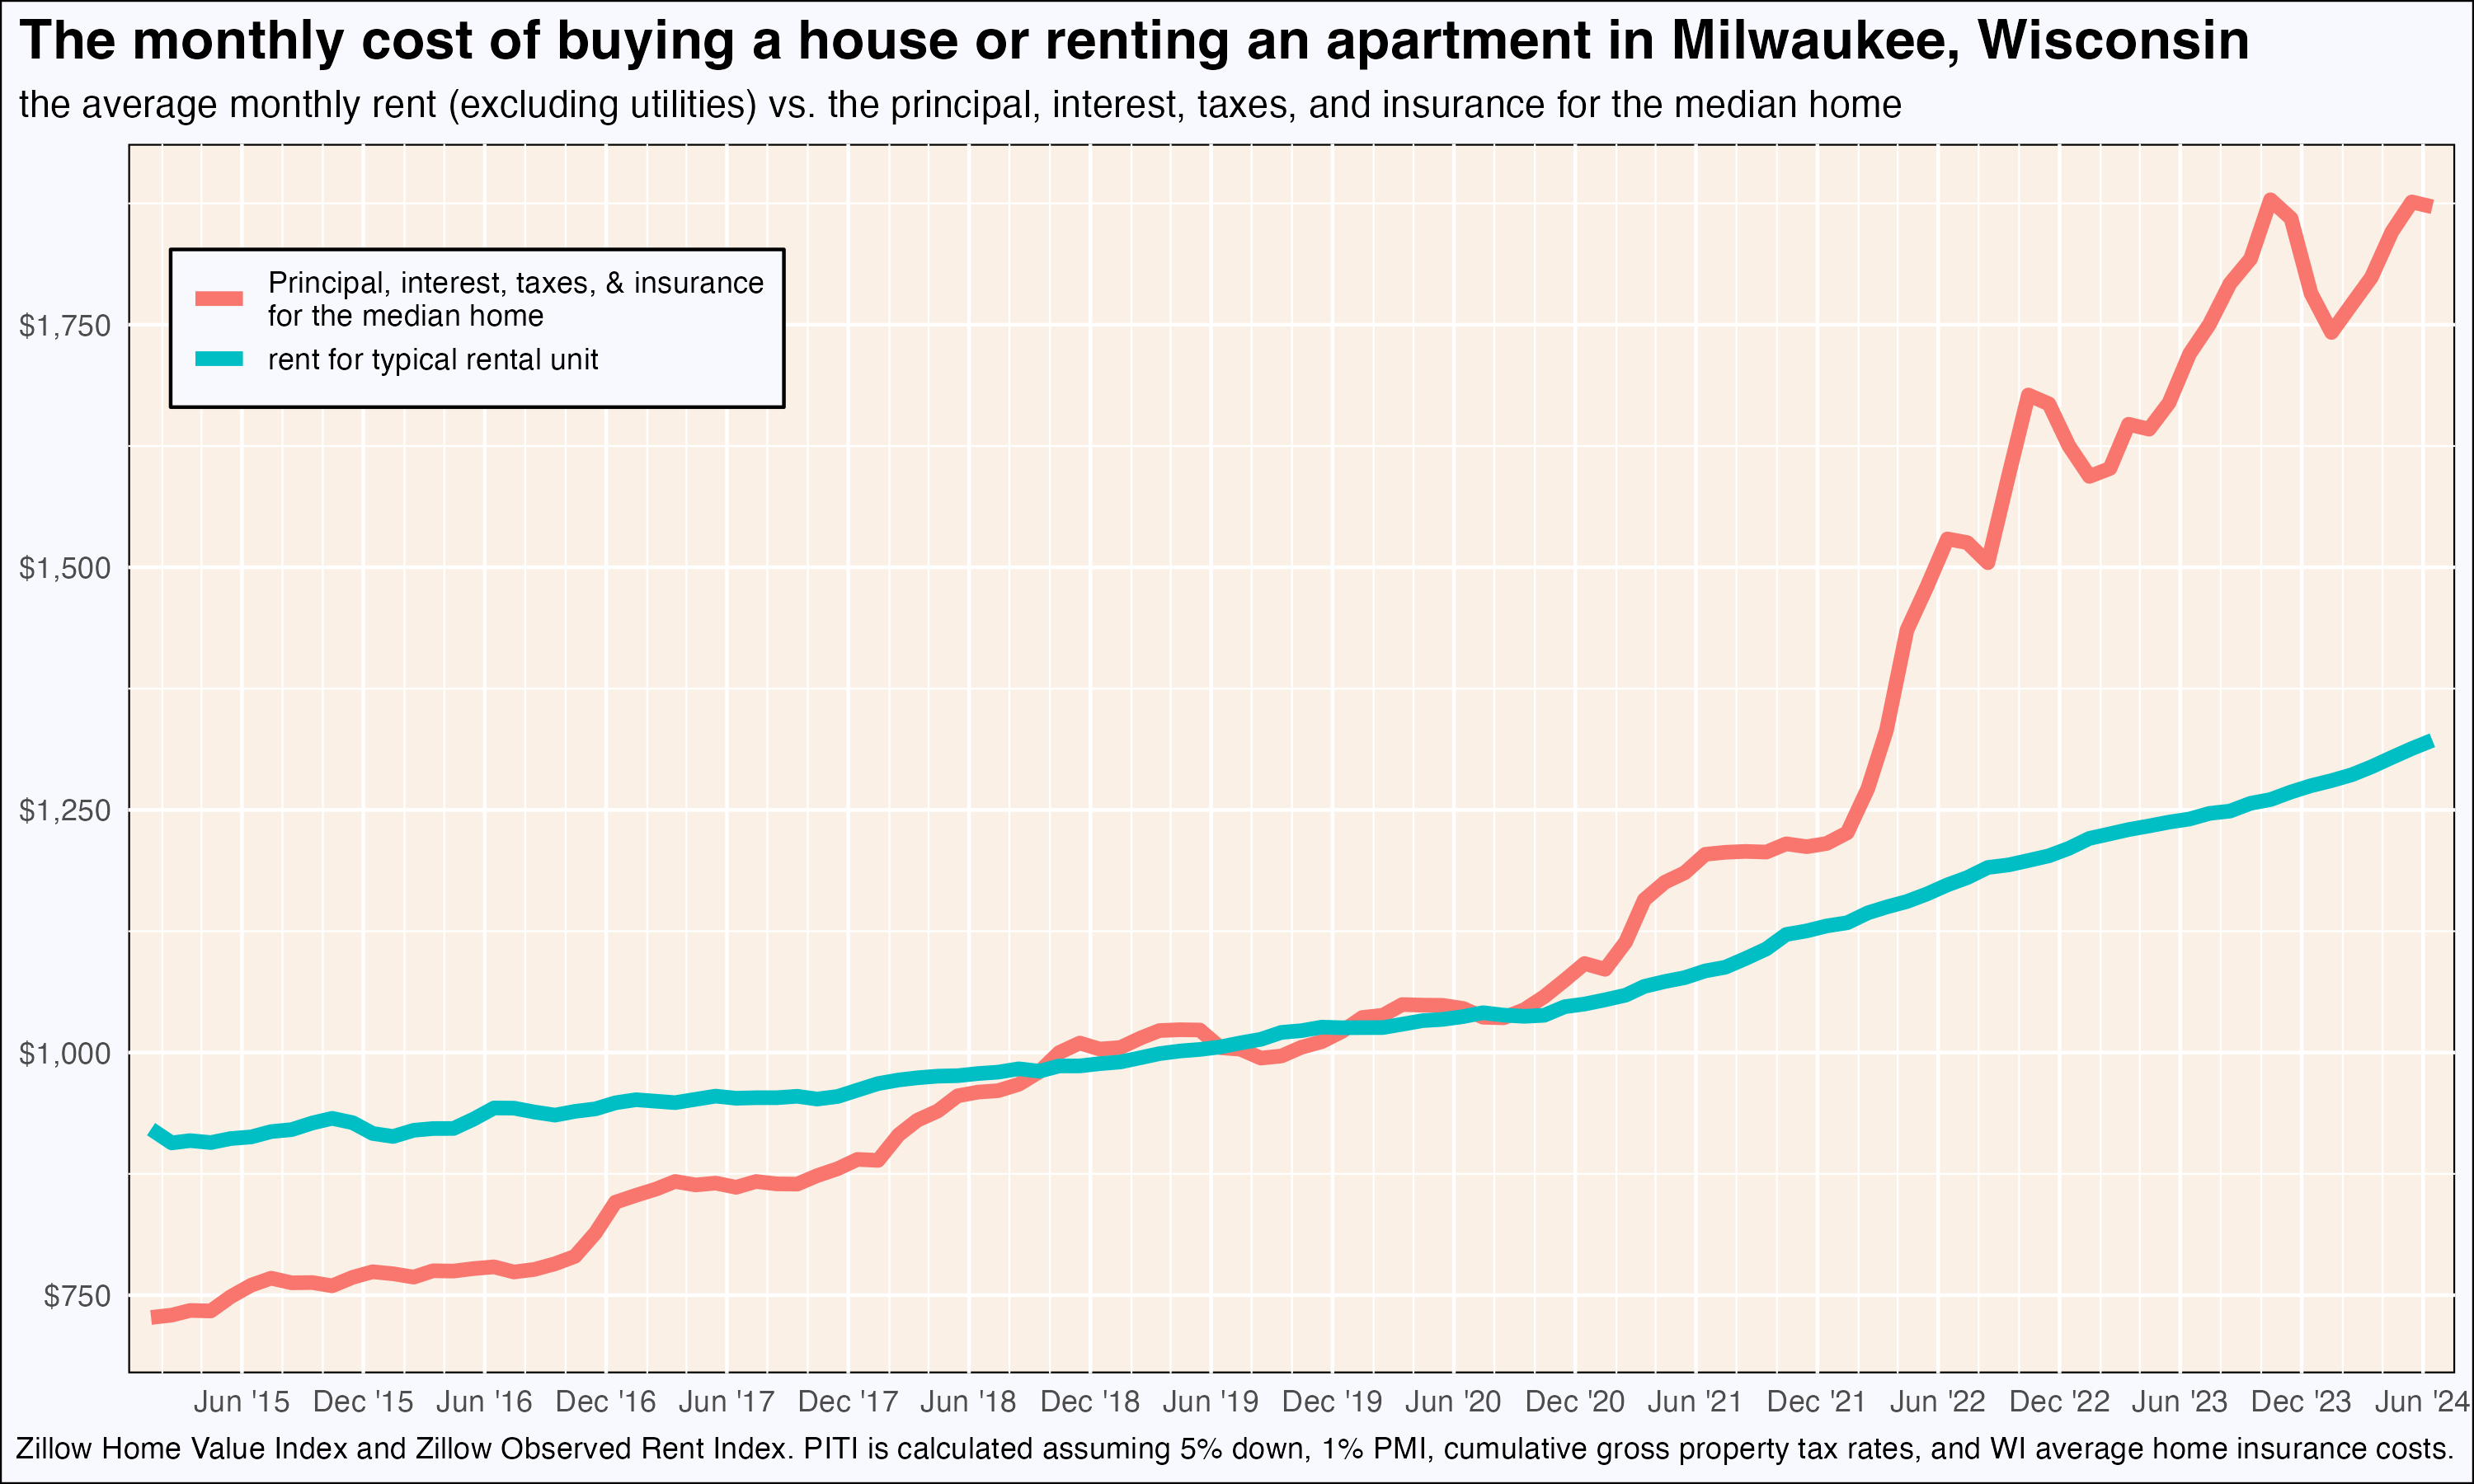
Here is an even simpler comparison. This graph shows the average monthly rent in Milwaukee in blue and the monthly payment needed to buy the average house in red. Before 2018, the PITI (principal, interest, taxes, and insurance) needed to buy the average Milwaukee house was cheaper than the monthly rent for the average apartment (of any size). The two costs were about tied from 2018 through 2020. Since then, the relative cost of owning has skyrocketed, while rents have grown more modestly. “From 2019 to 2024, the monthly costs needed to buy an average home in the city of Milwaukee grew by $854 or an increase of 83%. The average monthly rent grew by $316, or 31%.”
These comparisons of monthly cost ignore the equity accrued by homeowners. This equity is substantial for homeowners who bought during the 2010s, and those owners also benefit from the low interest rates they either initially received or refinanced into. While increased home values exclude a growing number of workers from the home-buying market, they are a windfall for incumbent owners. We estimate that someone who bought the average house in Milwaukee in 2019, paying 5% down, has accrued an average of $78,000 in equity.
Milwaukee remains more affordable than the great majority of major American cities, but home-buying has become far more difficult, even impossible, for many workers. And the financial benefit to buying a house instead of renting one is no longer as straightforward as during the late 2010s.