Putting a Face to the Harm—Commemorating Lives
![]() My previous blog post, Memory Matters—Recalling Rwanda, introduced the unforgettable experience I had at a 2024 summer conference in that country, which was held in conjunction with the 30th anniversary of the Genocide Against the Tutsi. What I saw, what I heard, what I felt furthered my foundational belief and commitment directing the Andrew Center for Restorative Justice at Marquette University Law School.
My previous blog post, Memory Matters—Recalling Rwanda, introduced the unforgettable experience I had at a 2024 summer conference in that country, which was held in conjunction with the 30th anniversary of the Genocide Against the Tutsi. What I saw, what I heard, what I felt furthered my foundational belief and commitment directing the Andrew Center for Restorative Justice at Marquette University Law School.
To begin basically: Memory, through storytelling, is essential to moving beyond violence and harm—the first step toward cultivating healing and safety for those harmed and accountability and compassion for those who harmed. In Rwanda, where more than one million children, women, and men were slaughtered over three months, any hope for peace requires remembering to commemorate those innocents who died because of ethnic hatred propagated in the name of revenge. In a country where genocide survivors and perpetrators are neighbors, co-workers, and even family members living side-by-side, that means putting a face to those behind the staggering statistics, which alone cannot truly speak to the senseless brutality.
Last July, I saw some of the faces during visits to two of nearly ten genocide memorials the Rwandan government created a decade after the unspeakable happened in summer 1994. This blog post is harder to write than the previous one because each of those faces—captured in time by photographs or symbolically present through stark physical remnants of the victims as well as perpetrators—represents a life story. Maurice, a guide at one of the memorials and genocide survivor, explained simply, “Sharing stories brings the humanity back to us.” That struck me. Who is remembered readily by loved ones left behind is why we all must not look away but rather remember through respectful commemoration. I write this perhaps-painful-to-read blog in that spirit.
Kigali Genocide Memorial
As the largest in the nation, the genocide memorial in the city of Kigali is the final resting place of more than 250,000 Tutsi murdered in the area. Funded in part by the city and organizations such as Aegis Trust, which facilitated the summer conference I attended, the memorial opened in 2004. It consists of the Exhibit Building, Burial Place, and Gardens of Reflection, all designed to serve as the starting point for education in peace and values, which is now built into Rwanda’s national school curriculum to strengthen community resilience against division. The site does so in many ways:
- Providing a dignified place of burial for Tutsi victims
- Educating visitors about the causes of the Genocide Against the Tutsi and other genocides throughout history and the world
- Teaching how to prevent future genocides
- Documenting evidence of the Genocide Against the Tutsi, testimonials of survivors, and stories of the victims
- Supporting survivors, especially widows and orphans.
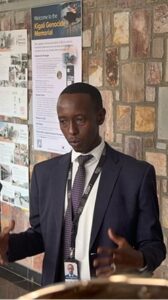 Accompanied by our guide, Maurice (pictured with permission), we first toured three permanent exhibitions at the Kigali memorial.
“The 1994 Genocide Against the Tutsi”
Detailing colonial roots of the ethnic hatred behind the genocide and the failure of the international community to intervene, this exhibit depicts the horrors and atrocities of 1994. That includes attempting to explain how friends, neighbors, and family members committed violent crimes against the Tutsi and Tutsi sympathizers—including brutality against women and children who, if not killed, were raped and mutilated in an effort to prevent a new generation of Tutsi from emerging.
“Wasted Lives”
Describing similar horrors including the Holocaust and Srebenica, this exhibit demonstrates that Rwanda is among too many instances of lives senselessly wasted through genocide.
“The Children’s Room”
A memorial to the murdered Tutsi children, this was the most painful exhibit for me and clearly the most real to Maurice, himself a child in 1994 who lost many in his family. Large pictures of boys and girls, each depicting the personal story behind the once-smiling face and including age and favorite foods, concluded with his/her last words, memories, and details of death. Some of those like Maurice who survived are also pictured, including quotes about watching their mothers chopped to death and witnessing babies slammed against walls. The inhumane acts I read about were so unthinkable that I don’t have the luxury to forget. Rather, I have the duty to relay, in order to commemorate the victims.
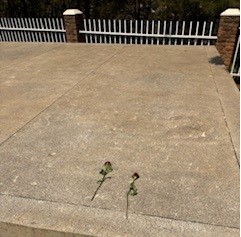 In stark contrast to the exhibitions’ vivid depictions and descriptions, two other parts of the memorial—the Burial Place and Gardens of Reflection—completed my visit. The sanctity of the underground tombs and concrete-covered mass graves filled with caskets and bones of unidentified victims forbids any photography inside. None is needed to feel the depth of such loss—compounded by the reality that remains continue to be found and placed in the tombs. The day I visited, two lone roses on the ground stood as sentinels to the quarter-million lives lost in this vicinity alone.
Nyamata Genocide Memorial
Another 10,000 lives are commemorated at the memorial located around the grounds of the former Nyamata Church. What remains of the church—where Tutsi sought refuge, only to be massacred over two weeks in April 1994—is a chilling site of remembrance, especially for women survivors who were systematically raped and abused in that once-hallowed space.
Led by a survivor-guide, I saw the tin roof riddled with bullet holes. A white altar cloth red from blood. Benches for prayer repurposed to display the clothing of the once prayerful. The basement that resembles catacombs, with coffins and racks of skulls and bones, including those of many infants. Haunting and profound words of survivors appear on plaques throughout the church, now sacred for a reason much different that the structure’s original intent. Two examples only:
“I remember the sound of blood flowing on the floor.”
“If you had known me, and you had really known yourself, you would not have killed me.”
The memorials I experienced are vital reminders of the human capacity for evil and destruction. But if we allow the story to end there, we fail those who perished. In my next blog post, I will plumb the better side of humankind as I share my visit to the Rweru Reconciliation Village—a model of hope rooted in the human capacity to forgive and build peace.
Thank you for being on this journey with me.